
رد: Elliott Wave Analysis by EWF
KBW Bank Index Extended Correction
KBW Bank Index is an economic index consisting of the stocks of 24 banking companies delivering a direct exposure to the banking sector and offering a targeted view to a unique corner of the U.S. financial sector. The top holdings Banks of the index are among the biggest financial institutes in the world and most of them will report earning during this week ( Citigroup, JPMorgan Chase, Wells Fargo, Bank of America). These companies have a big influence on the financial sector that can be measured by the ETF (XLF), which was up 30% from last year until last month, we mentioned in our previous financial article that XLF was reaching an inflection area which provided the expected pullback.
How this move is affecting the Banking sector ? Let’s find out by using the Elliott Wave Theory to analyze BKX.
KBW Bank Index Elliott Wave View
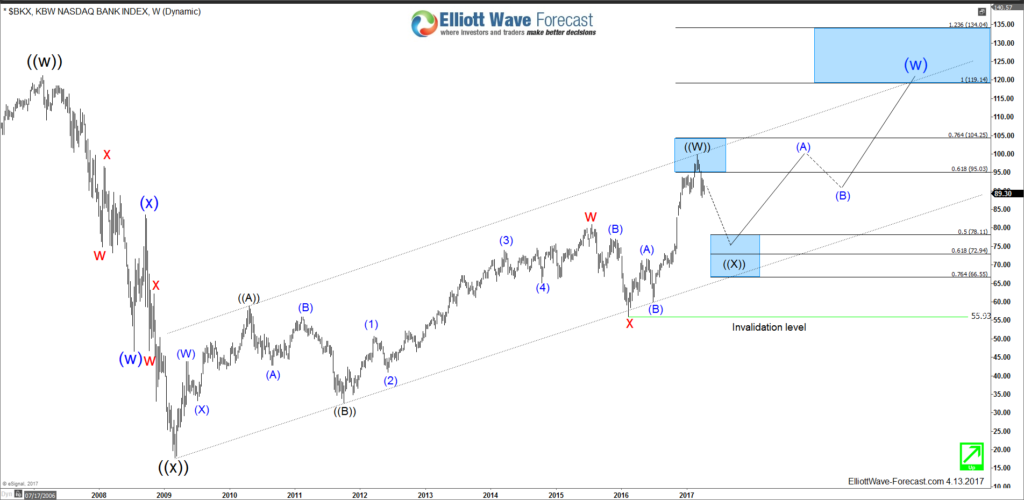
BKX made 5 swings bullish sequence from 2009 low which is different from the 5 impulsive waves used in Elliott Wave Theory. The advance is a part of the double three structure that KBW Bank Index is doing and after reaching the 61.8 – 76.4 fib ext area it started the 6th swing pullback against 2016 low. The retrace in wave ((X)) would ideally reach the 50%-61.8% Fibonacci retracement around 78.11 – 72.94 area before BKX can resume it’s move to the upside. However market isn’t perfect and we can’t determine how the pullback will unfold exactly so even a small 3 waves pullback can be enough to end it there.
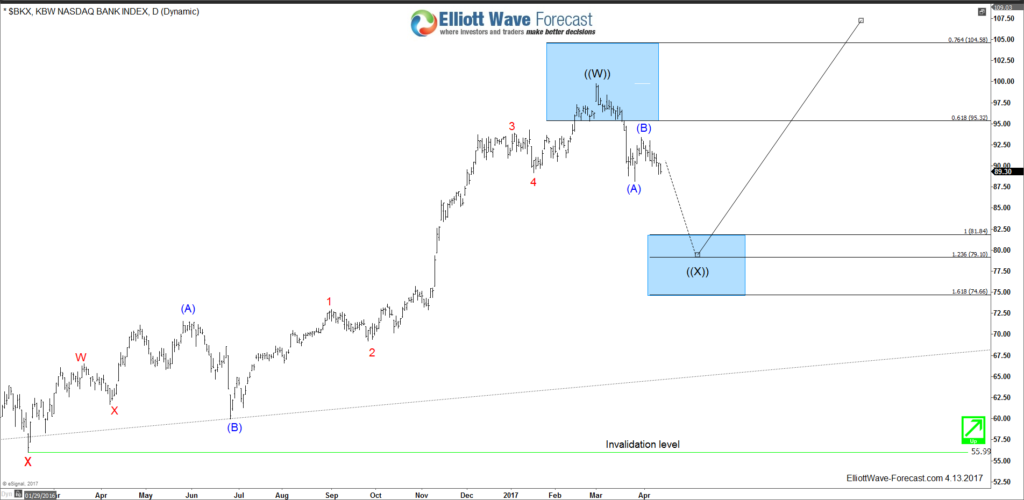
To determine the potential pullback area, we take a look at the daily chart as the Index ended the 2016 cycle at 03/01/2017 peak from which it’s started a Zigzag structure. So BKX can still extend lower toward equal legs area 81.84 – 79.10 from which it can resume higher or bounce in 3 waves at least.
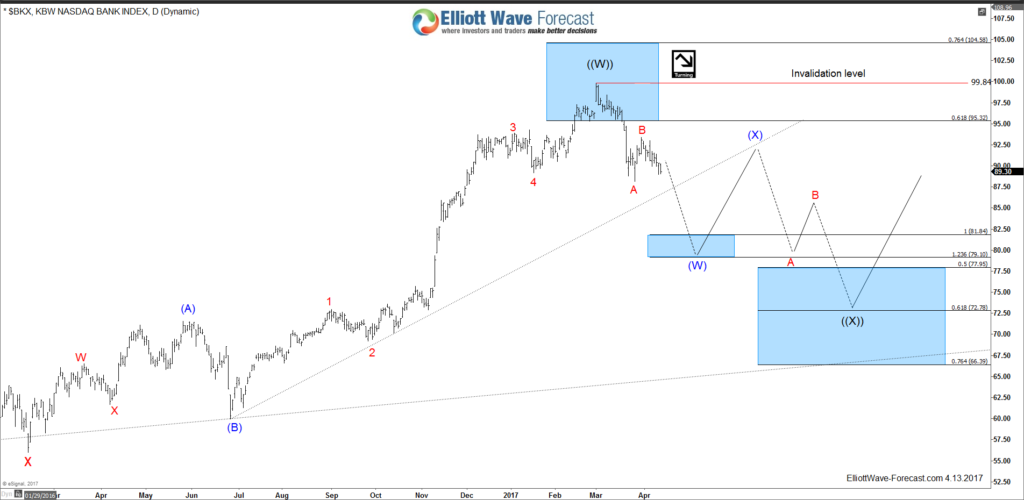
If the bounce is not strong enough and the Index fails to break above 99.84 peak, then it will have the possibility of doing the double three correction lower toward the 61.8%-76.4% area and retesting the 2009 trend-line before it can be able to resume it’s uptrend.
Recap
KBW Bank Index longer term technical structure remain bullish while it’s holding above 2016 low 55.99. But we need further data before we can determine if the index will be able to rally for new highs after this current shallow daily correction or it needs more time to consolidate. This decline will affect the whole Financial sector and its stocks can be fading the so called Trump rally so you need to be careful about holding a bank stock during this pullback.


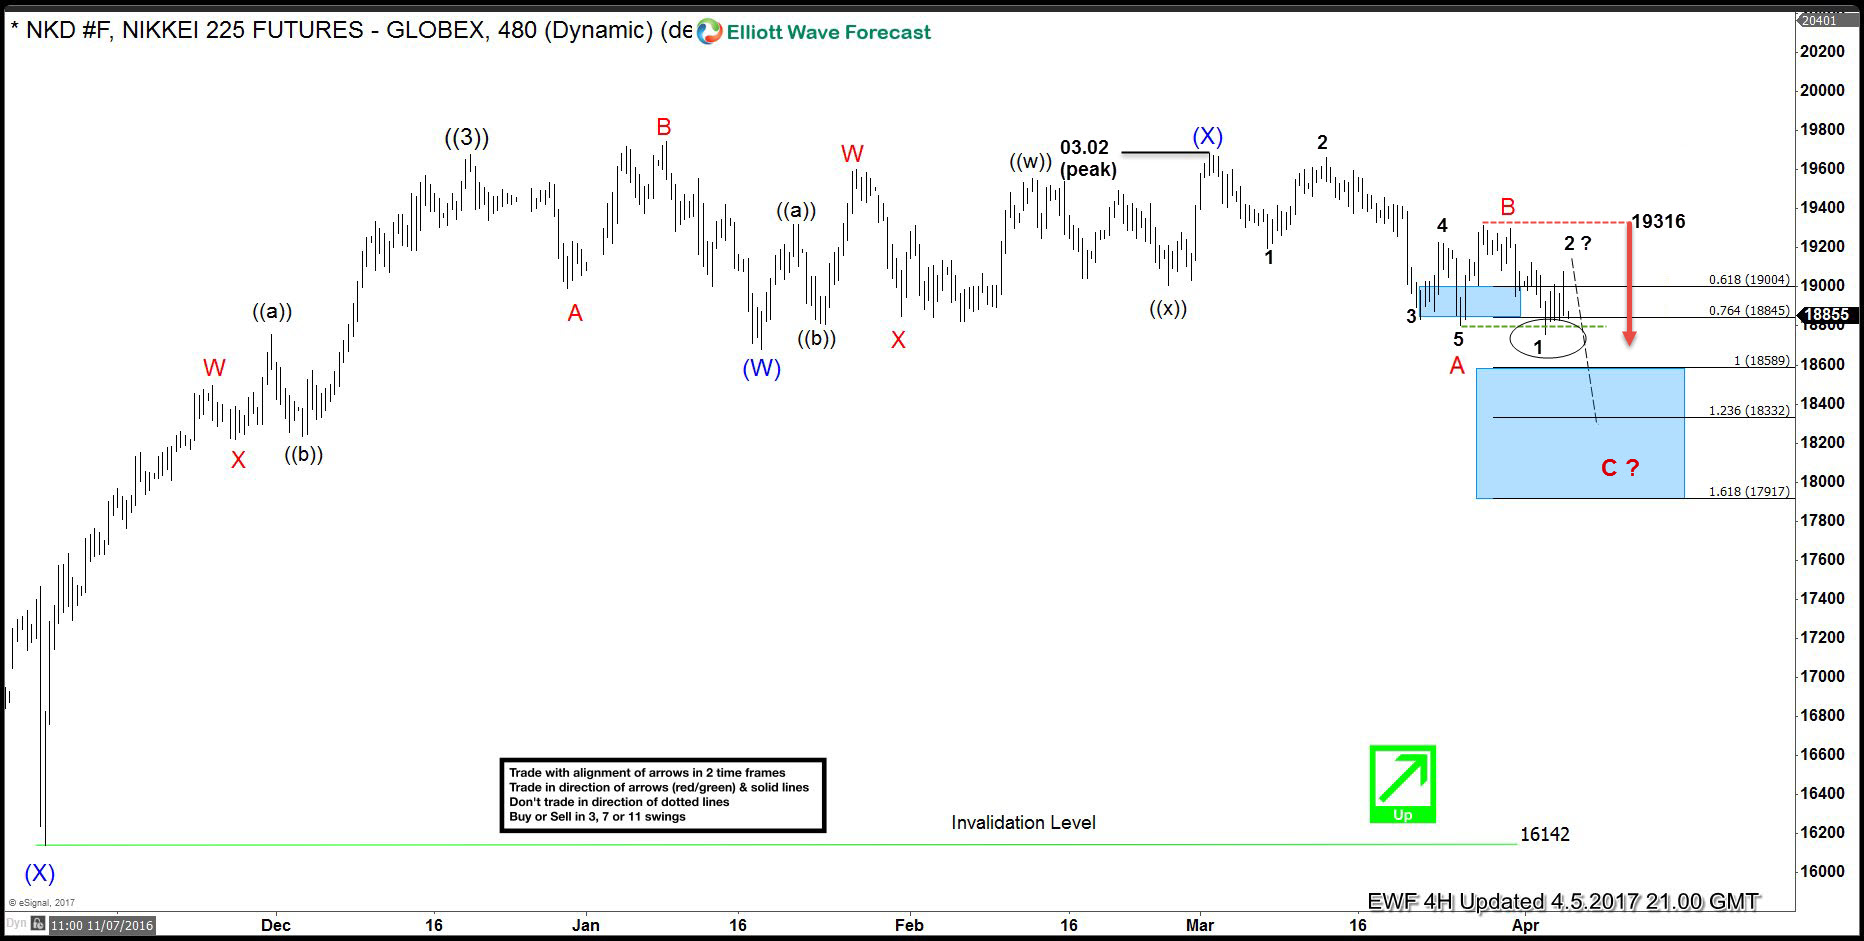
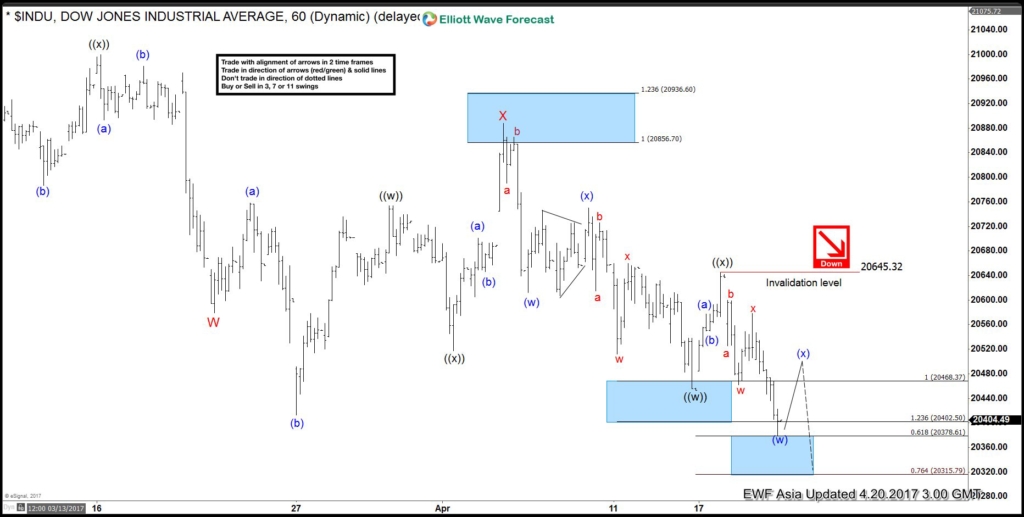
 of ((ii)) toward 19034-19100 area. At that zone sellers will be waiting for further decline toward proposed taget area: 18589-17917
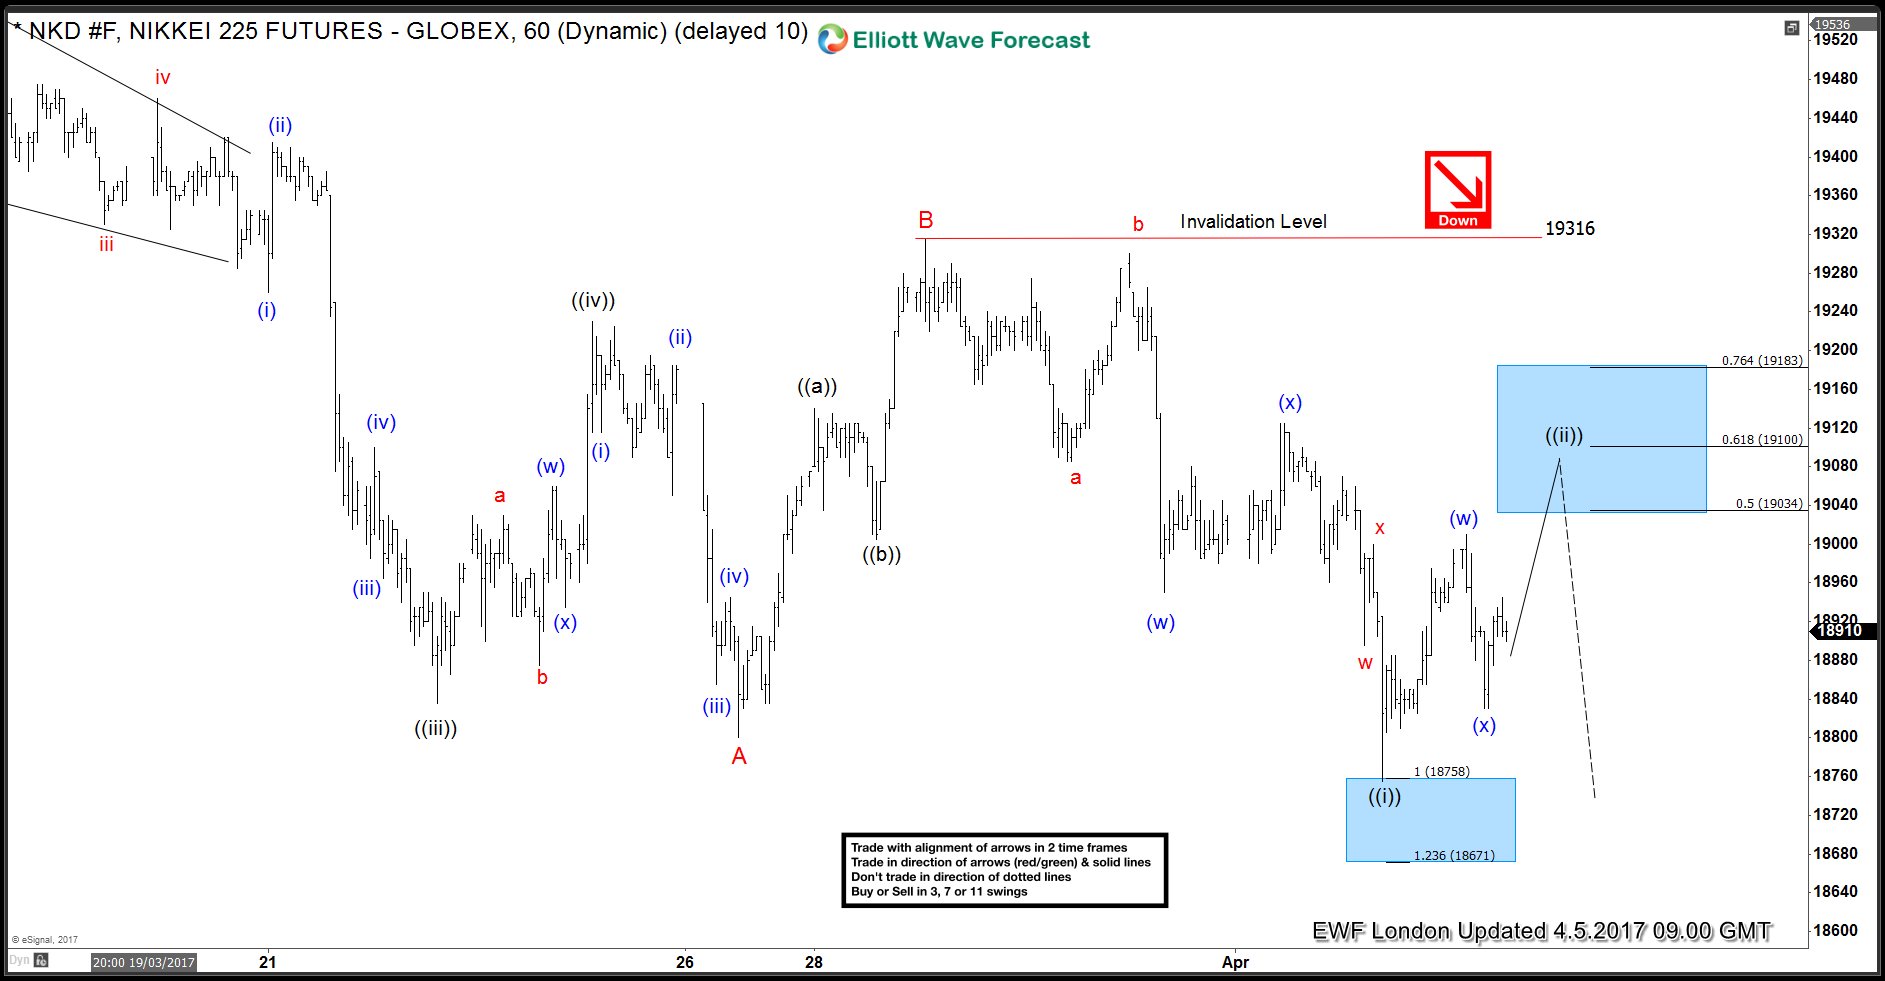
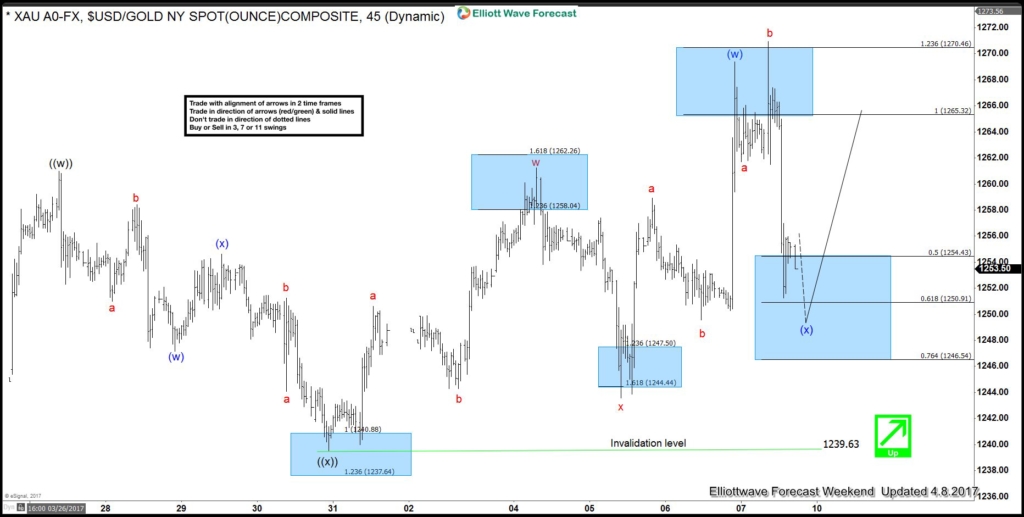
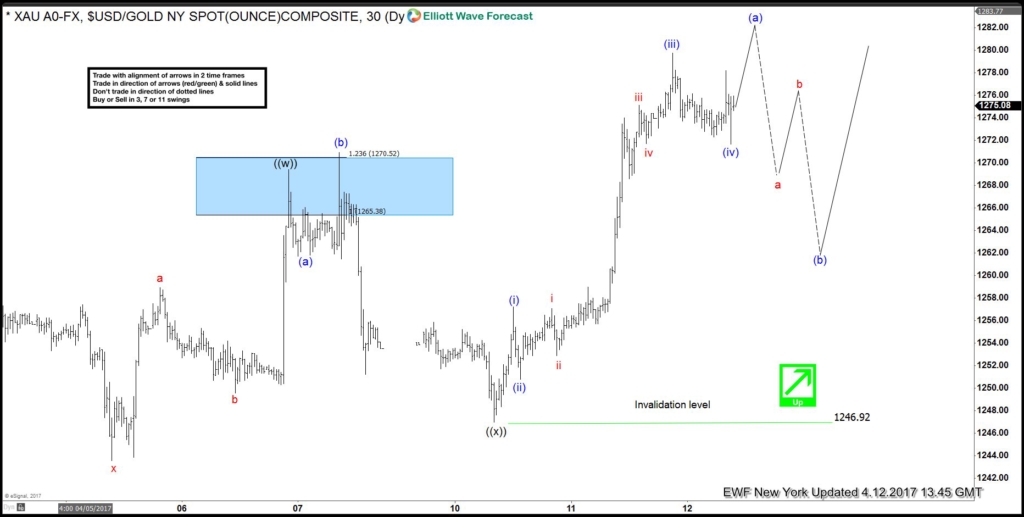
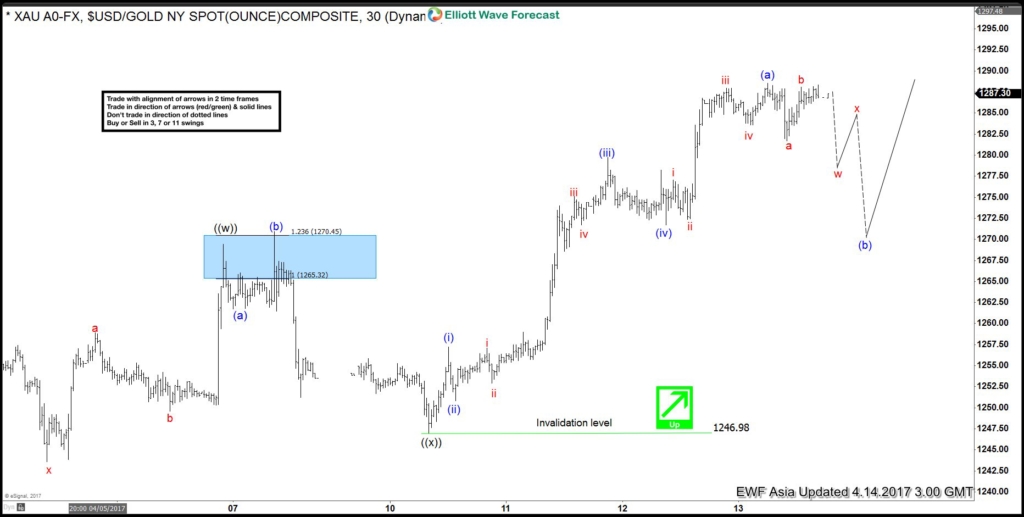
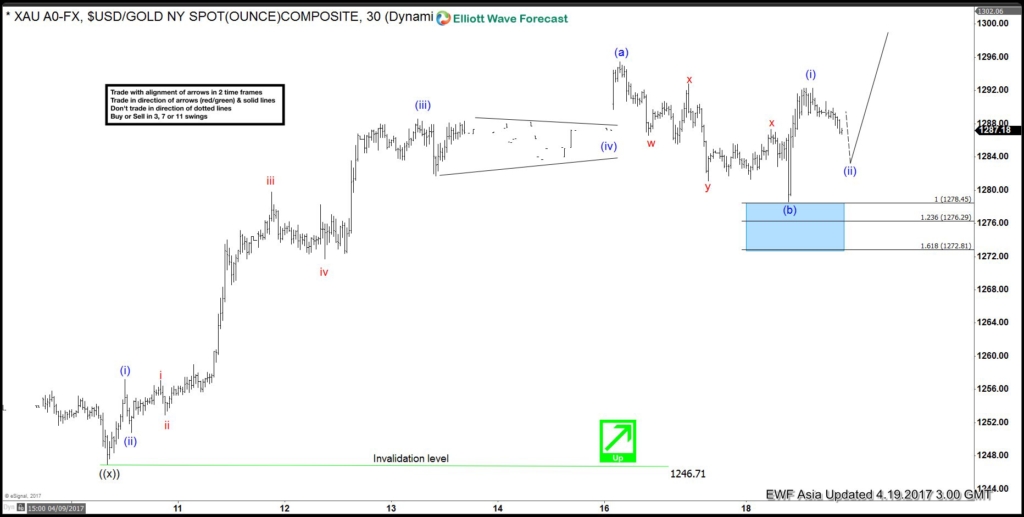
 ) ended at 1257.2, Minutte wave (ii) ended at 1250.8, Minutte wave (iii) ended at 1279.75, Minutte wave (iv) ended at 1271.69 and Minutte wave (v) of (a) ended at yesterday’s peak 1295.6. Below from there metal has started the Minutte wave (b) pullback to correct 4/10 (1246.9) cycle and that could be done already in 3 swings at earlier low 1281, where Sub minutte wave a ended at 1285.6 and Sub minutte wave b ended at 1292.6. However metal needs to break 1295.6 peak first for final confirmation of next leg higher started, If it fails to rally from here then Double correction from the peak within the Minutte wave (b) pullback can’t be ruled out yet before the rally resume, where we would like to be buyer’s again. Now as far as trading above earlier low 1281 and more importantly as far as pivot from 4/10 low remains intact metal has scope to resume the upside. We don’t like selling the metal into the pullbacks & favors the upside in metal as far as pivot from 4/10 low remains intact.
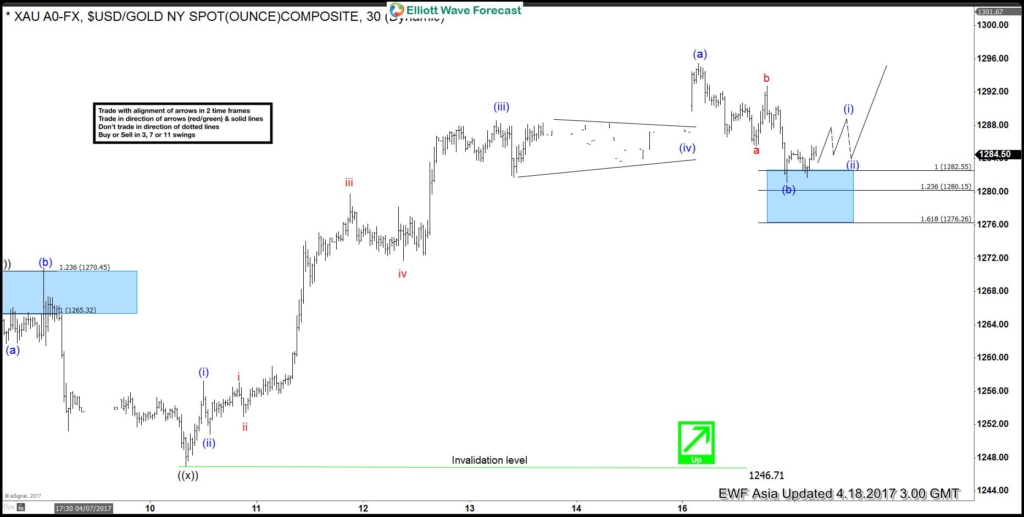
 المواضيع المتشابهه


 17Likes