• 8:08 صباحاً


Elliott Wave Analysis by EWF

إضافة رد
Like Tree17Likes

أدوات الموضوع
عضو نشيط
 
تاريخ التسجيل: Dec 2013
الدولة: Tunisia
المشاركات: 282
خبرة السوق: أكثر من 5 سنوات
معدل تقييم المستوى: 11
Ayoub Ben Rejeb is on a distinguished road
افتراضي رد: Elliott Wave Analysis by EWF
61#
09 - 05 - 2017, 01:27 PM
How Bullish is the SPX, Can it see 3189 area?

This is Elliott Wave analysis on SPX and DJUSRE (Dow Jones Real Estate Index) in which we are going to take a look if SPX can reach the 3189 area to the upside before ending the all time cycle. In order to answer it, we will look for a clue in the market by analyzing DJUSRE. The DJUSRE (Dow Jones Real Estate Index) is following similar cycles with the world indices, but correlating DJUSRE with SPX and other world indices, DJUSRE is lagging and hasn’t broken the 2007 peak yet. If the Real Estate Index manages to break above 2007 peak, it will show incomplete bullish sequence and can eventually see 454- 541 area to the upside. That area in DJUSRE then can allow SPX to see the 3189 area next before ending the cycle from 2009 lows and index should correct the all time cycle.

DJUSRE Long Term Elliott Wave View


SPX Long Term Elliott Wave Chart


Ayoub Ben Rejeb غير متواجد حالياً  
رد مع اقتباس

عضو نشيط
 
تاريخ التسجيل: Dec 2013
الدولة: Tunisia
المشاركات: 282
خبرة السوق: أكثر من 5 سنوات
معدل تقييم المستوى: 11
Ayoub Ben Rejeb is on a distinguished road
افتراضي رد: Elliott Wave Analysis by EWF
62#
10 - 05 - 2017, 02:28 PM
SPX Elliott Wave View: Mature Cycle

Short Term Elliott Wave view in SPX suggests the rally from 3/27 low (2322.2) is unfolding as a leading diagonal Elliott Wave structure where Minute wave ((i)) ended at 2378.36, Minute wave ((ii)) ended at 2328.95, Minute wave ((iii)) ended at 2398.16, and Minute wave ((iv)) ended at 2379.75. The Index has broken above previous Minute wave ((iii)) and thus it has met the minimum requirement in the number of swing to end cycle from 3/27 low as a leading diagonal. However, while near term pullbacks stay above 2380, further upside in one more leg still can’t be ruled out before cycle from 3/27 low ends. Near term, Minute wave (v) is proposed to be unfolding as a zigzag Elliott Wave structure where Minutte wave (a) ended at 2403.8 and Minutte wave (b) ended at 2392.4. While pullbacks stay above 2392.4, and more importantly above 2380, Index has scope to extend one more leg higher. We don’t like selling the Index.

SPX 1 Hour Elliott Wave Chart 05/10/2017

Ayoub Ben Rejeb غير متواجد حالياً  
رد مع اقتباس
عضو نشيط
 
تاريخ التسجيل: Dec 2013
الدولة: Tunisia
المشاركات: 282
خبرة السوق: أكثر من 5 سنوات
معدل تقييم المستوى: 11
Ayoub Ben Rejeb is on a distinguished road
افتراضي رد: Elliott Wave Analysis by EWF
63#
11 - 05 - 2017, 12:47 PM
SPX Elliott Wave View: Near Pullback

Short Term Elliott Wave view in SPX suggests the rally from 3/27 low (2322.2) is unfolding as a leading diagonal Elliott Wave structure where Minute wave ((i)) ended at 2378.36, Minute wave ((ii)) ended at 2328.95, Minute wave ((iii)) ended at 2398.16, and Minute wave ((iv)) ended at 2379.75. The Index has broken above previous Minute wave ((iii)) and thus it has met the minimum requirement in the number of swing to end cycle from 3/27 low as a leading diagonal. Although the cycle from 3/27 low is already mature, another leg higher can’t be ruled out as far as pullbacks stay above 2380. Near term, Minute wave (v) is proposed to be unfolding as a zigzag Elliott Wave structure where Minutte wave (a) ended at 2403.8 and Minutte wave (b) ended at 2392.4. While pullbacks stay above 2392.4, and more importantly above 2380, Index has scope to extend one more leg higher. We don’t like selling the Index and chasing the last leg higher here is also a bit risky. Expect cycle from 3/27 low to end soon with or without one more leg higher and Index to do larger degree pullback in 3, 7, or 11 swing to correct cycle from 3/27 low before the rally resumes.

SPX 1 Hour Elliott Wave Chart 05/11/2017

Ayoub Ben Rejeb غير متواجد حالياً  
رد مع اقتباس
عضو نشيط
 
تاريخ التسجيل: Dec 2013
الدولة: Tunisia
المشاركات: 282
خبرة السوق: أكثر من 5 سنوات
معدل تقييم المستوى: 11
Ayoub Ben Rejeb is on a distinguished road
افتراضي رد: Elliott Wave Analysis by EWF
64#
12 - 05 - 2017, 12:37 PM
SPX Elliott Wave View: Pull back started

Short Term Elliott Wave view in SPX suggests the rally from 3/27 low (2322.2) ended at 2403 as a leading diagonal Elliott Wave structure where Minute wave ((i)) ended at 2378.3, Minute wave ((ii)) ended at 2328.95, Minute wave ((iii)) ended at 2398.16, Minute wave ((iv)) ended at 2379.75, and Minute wave ((v)) of A ended at 2403. Near term, while bounces remain below there expect the Index to pull back in larger degree 3, 7, or 11 swings to correct cycle from 3/27 low before the rally resumes again. We don’t like selling the Index and expect buyers to appear after 7 or 11 swings pull back for extension higher. This view remains valid as far as pivot at 3/27 (2322.2) low remains intact.

SPX 1 Hour Elliott Wave Chart 05/12/2017

Ayoub Ben Rejeb غير متواجد حالياً  
رد مع اقتباس
عضو نشيط
 
تاريخ التسجيل: Dec 2013
الدولة: Tunisia
المشاركات: 282
خبرة السوق: أكثر من 5 سنوات
معدل تقييم المستوى: 11
Ayoub Ben Rejeb is on a distinguished road
افتراضي رد: Elliott Wave Analysis by EWF
65#
12 - 05 - 2017, 01:12 PM
Macron’s Triumph Removes Eurozone Political Risk

Emmanuel Macron won the presidential election last Sunday, defeating Marine Le Pen, a far-right nationalist who wanted to take France out of the European Union. Markets had feared that Le Pen’s win could threaten the EU project, but Macron’s win has eliminated uncertainty regarding France’s membership of the Euro and removed the risk of near-term severe political shock to France and wider Europe. The Euro went above $1.10 briefly, but since then has pulled back. The upwards move was not dramatic than the first round of French elections as many traders have anticipated Macron’s victory and thus victory was already well priced in.

The new president has promised economic reforms to restore France’s competitiveness, but Macron currently only has a newly formed minor party and it’s unclear how much support he will get given at least half of its parliamentary candidates will have no prior political affiliations. Thus, the market has now turned its attention to the next legislative election in June. Macron needs to get majority in the National Assembly, otherwise the Prime Minister who exercises the main executive authority, could be a part of the opposition and may ignore his program. It’s crucial for Macron to succeed in parliamentary elections next month in order to enact his reforms.

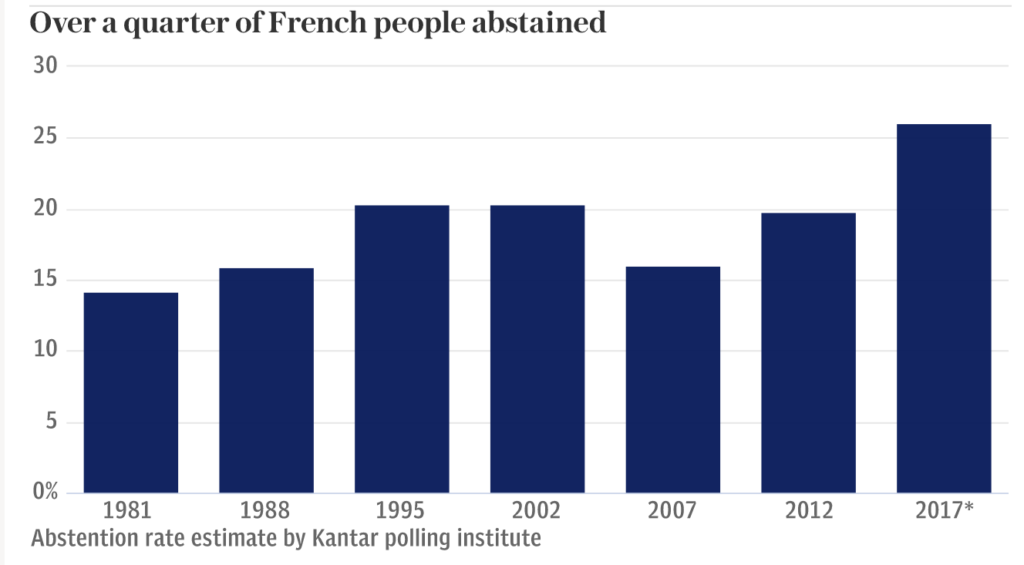
Macron’s task won’t be easy as he is going to assume a presidency of a nation that is still very divided. One third of French people who voted preferring Le Pen and populism, and over a quarter of French people abstained in the voting. This is one of the highest abstention rates in the history of France and for the first time in the history of France, the election didn't have candidate from the main parties of the left and right. If Macron falls short of a majority in the June’s legislative election, he would need to form a governing coalition with other parties. And if another party wins a majority, then he needs to deal with the rival party during periods called cohabitation.


With France’s traditional party system losing confidence by the voters, the risks of cohabitation and political dysfunction have increased. If an opposition party won the majority in National Assembly, Macron will likely be unable to carry out his ambitious political reform. During cohabitation period, normally the president will have a diminished role, and the Premier (Prime Minister) is the one who exercise main executive policy making authority. If, on the other hand, Macron’s party secures parliamentary majority, Macron’s presidency will be smooth and he will be able to implement his agendas.

Despite the uncertainty in the coming June ‘s legislative election, the triumph of Macron is still important as it has removed the worst case scenario for the short term, and this may provide some sort of floor to Euro dollar weaknesses.

EURJPY Long Term Elliott Wave View


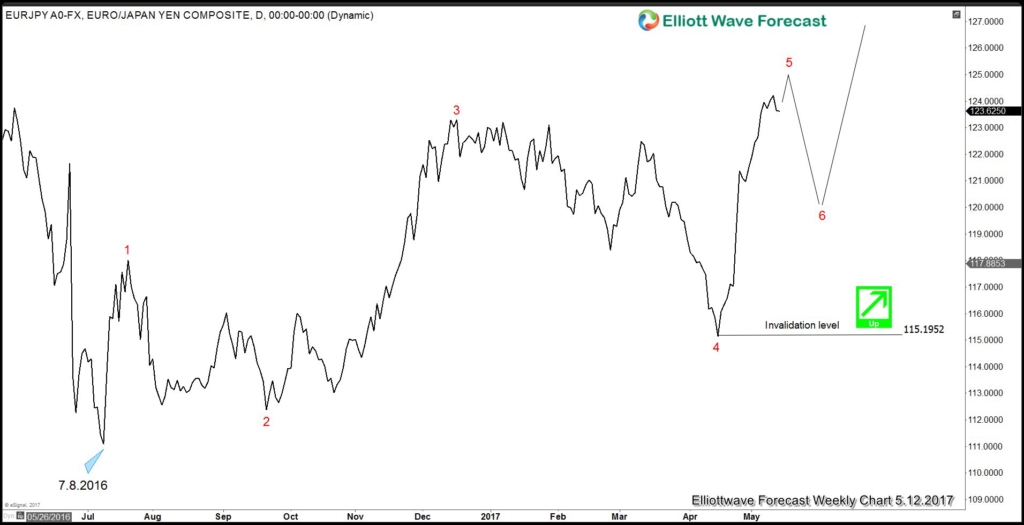
Daily chart of EURJPY is showing a 5 swing sequence from 7.8.2016 low, suggesting that as far as pair stays above swing #4 (115.19), it has scope to extend higher. How does this impact the more popular EURUSD? We can look at the correlation between the two pairs below

Overlay of EURJPY and EURUSD


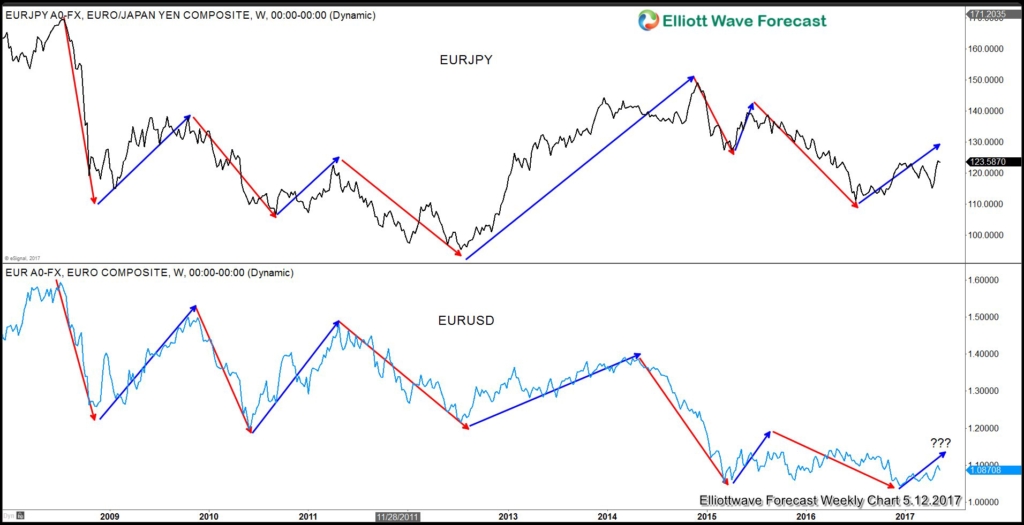
An overlay of EURJPY and EURUSD chart above shows that the move in the two pairs could have a different degree of strength in certain period. For instance, the move during the period of 2015 – 2017 in EURJPY did not create a new low below 2012 low while the move in EURUSD in the same period produced a new low. Despite the different degree of strength, the two pairs still share remarkable similar oscillation and if one pair is trending higher, the other one is likely also moving in the same direction and vice versa. We have seen in the first chart that EURJPY has a bullish sequence from 6.24.2017 low and thus the pair can see an extension higher. Based on the correlation chart above, we may conclude that EURUSD should not see a lot of weaknesses if EURJPY is expected to continue to the upside in 7 swing.
Ayoub Ben Rejeb غير متواجد حالياً  
رد مع اقتباس
عضو نشيط
 
تاريخ التسجيل: Dec 2013
الدولة: Tunisia
المشاركات: 282
خبرة السوق: أكثر من 5 سنوات
معدل تقييم المستوى: 11
Ayoub Ben Rejeb is on a distinguished road
افتراضي رد: Elliott Wave Analysis by EWF
66#
16 - 05 - 2017, 03:20 PM
FTSE Elliott Wave View: Mature Cycle

Short Term Elliott Wave view in FTSE suggests the rally from 4/20 low (7096.6) is unfolding as a zigzag Elliott Wave structure where Minute wave ((a)) ended at 7302.57 and Minute wave ((b)) ended at 7197.28. Subdivision of Minute wave ((a)) is unfolding as an impulse where Minuttte wave (i) ended at 7134.53, Minutte wave (ii) ended at 7104.22, Minutte wave (iii) ended at 7290.82, Minutte wave (iv) ended at 7262.32, and Minutte wave (v) of ((a)) ended at 7302.57. Index has since broken above 7302.57 suggesting Minutte wave ((c)) has started.

Minute wave ((c)) is currently in progress as an ending diagonal where Minutte wave (i) ended at 7280.7, Minutte wave (ii) ended at 7222.81, Minutte wave (iii) ended at 7398.58, and Minutte wave (iv) ended at 7369.23. Index has reached 1.236 extension of the Minute ((a)) – ((b)) and thus minimum requirement has been met for Minor wave 1 to complete and cycle from 4/20 low to end, although a marginal high still can’t be ruled out at this stage. Expect Index to correct cycle from 4/20 low soon within Minor wave 2 in 3, 7, or 11 swing before the rally resumes. We don’t like selling the proposed pullback and expect buyers to appear again when Minor wave 2 pullback is over in 3, 7, or 11 swing.

FTSE 1 Hour Elliott Wave Chart 05/16/2017

Ayoub Ben Rejeb غير متواجد حالياً  
رد مع اقتباس
عضو نشيط
 
تاريخ التسجيل: Dec 2013
الدولة: Tunisia
المشاركات: 282
خبرة السوق: أكثر من 5 سنوات
معدل تقييم المستوى: 11
Ayoub Ben Rejeb is on a distinguished road
افتراضي رد: Elliott Wave Analysis by EWF
67#
17 - 05 - 2017, 04:43 PM
FTSE Index Elliott Wave View: Ending A Cycle

Short Term Elliott Wave view in FTSE Index suggests the rally from 4/20 low (7096.6) is unfolding as a zigzag Elliott Wave structure where Minute wave ((a)) ended at 7302.57 and Minute wave ((b)) ended at 7197.28. Subdivision of Minute wave ((a)) is unfolding as an impulse where Minuttte wave (i) ended at 7134.53, Minutte wave (ii) ended at 7104.22, Minutte wave (iii) ended at 7290.82, Minutte wave (iv) ended at 7262.32, and Minutte wave (v) of ((a)) ended at 7302.57. FTSE Index has since broken above 7302.57 suggesting Minute wave ((c)) has started.

Minute wave ((c)) is currently in progress as an ending diagonal where Minutte wave (i) ended at 7280.7, Minutte wave (ii) ended at 7222.81, Minutte wave (iii) ended at 7460.20, and Minutte wave (iv) ended at 7435.64. Index has reached 1.618 extension of the Minute ((a)) – ((b)) and thus cycle from 4/20 low is mature and Minor wave 1 can be called completed at 7533.7. Expect FTSE Index to correct cycle from 4/20 low soon within Minor wave 2 in 3, 7, or 11 swing before the rally resumes. We don’t like selling the proposed pullback and expect buyers to appear again when Minor wave 2 pullback is over in 3, 7, or 11 swing.

If the Index does not do a decent pullback from here to correct cycle from 4/20 low, then the move from 4/20 low could be instead labelled as a regular 5 waves Impulse Elliott Wave structure in which case we are ending Minor wave 3 at recent high (7533.7) and the Index will do shallow pullback in Minor wave 4 and then extend higher again in Minor wave 5 before ending cycle from 4/20 low and see larger pullback. In both cases, we don’t like selling the Index and expect buyers to appear in the dips in 3, 7 or 11 swings.

FTSE Index 1 Hour Elliott Wave Chart 05/17/5017

Ayoub Ben Rejeb غير متواجد حالياً  
رد مع اقتباس
عضو نشيط
 
تاريخ التسجيل: Dec 2013
الدولة: Tunisia
المشاركات: 282
خبرة السوق: أكثر من 5 سنوات
معدل تقييم المستوى: 11
Ayoub Ben Rejeb is on a distinguished road
افتراضي رد: Elliott Wave Analysis by EWF
68#
18 - 05 - 2017, 01:53 PM
FTSE 100 Elliott Wave View: Turning Lower

Short Term Elliott Wave view in FTSE 100 suggests the rally from 4/20 low (7096.6) is unfolding as a zigzag Elliott Wave structure where Minute wave ((a)) ended at 7302.57 and Minute wave ((b)) ended at 7197.28. Subdivision of Minute wave ((a)) is unfolding as an impulse where Minuttte wave (i) ended at 7134.53, Minutte wave (ii) ended at 7104.22, Minutte wave (iii) ended at 7290.82, Minutte wave (iv) ended at 7262.32, and Minutte wave (v) of ((a)) ended at 7302.57. FTSE 100 has since broken above 7302.57 suggesting Minute wave ((c)) has started.

Minute wave ((c)) is unfolding as an ending diagonal where Minutte wave (i) ended at 7280.7, Minutte wave (ii) ended at 7222.81, Minutte wave (iii) ended at 7460.20, and Minutte wave (iv) ended at 7435.64. Index has reached 1.618 extension of the Minute ((a)) – ((b)) and thus cycle from 4/20 low is mature and we are calling Minor wave 1 completed at 7533.7. Expect FTSE 100 to correct cycle from 4/20 low within Minor wave 2 in 3, 7, or 11 swing before the rally resumes. We don’t like selling the proposed pullback and expect buyers to appear again when Minor wave 2 pullback is over in 3, 7, or 11 swing.

If the Index does not do a decent pullback from here to correct cycle from 4/20 low, then the move from 4/20 low could be labelled as a regular 5 waves Impulse Elliott Wave structure in which case we are ending Minor wave 3 at recent high (7533.7) and the Index will do shallow pullback in Minor wave 4 and then extend higher again in Minor wave 5 before ending cycle from 4/20 low and see larger pullback. In both cases, we don’t like selling the Index and expect buyers to appear in the dips in 3, 7 or 11 swings.

FTSE 100 1 Hour Elliott Wave Chart 05/18/2017

Ayoub Ben Rejeb غير متواجد حالياً  
رد مع اقتباس
عضو نشيط
 
تاريخ التسجيل: Dec 2013
الدولة: Tunisia
المشاركات: 282
خبرة السوق: أكثر من 5 سنوات
معدل تقييم المستوى: 11
Ayoub Ben Rejeb is on a distinguished road
افتراضي رد: Elliott Wave Analysis by EWF
69#
23 - 05 - 2017, 02:18 PM
FTSE Elliott Wave View: Extending Higher

Short Term Elliott Wave view in FTSE suggests the rally from 4/20 low (7096.6) is unfolding as a zigzag Elliott Wave structure where Minute wave ((a)) ended at 7302.57 and Minute wave ((b)) ended at 7197.28. Subdivision of Minute wave ((a)) unfolded as an impulse where Minuttte wave (i) ended at 7134.53, Minutte wave (ii) ended at 7104.22, Minutte wave (iii) ended at 7290.82, Minutte wave (iv) ended at 7262.32, and Minutte wave (v) of ((a)) ended at 7302.57. The Index then pullback and ended Minute wave ((b)) at 7197.28

Minute wave ((c)) unfolded as an ending diagonal where Minutte wave (i) ended at 7280.7, Minutte wave (ii) ended at 7222.81, Minutte wave (iii) ended at 7460.20, and Minutte wave (iv) ended at 7435.64. Index has reached 1.618 extension of the Minute ((a)) – ((b)) and thus cycle from 4/20 low is mature and we are calling Minor wave 1 completed at 7533.7. Minor wave 2 decline from there is proposed complete at 7389.26. The Index has since resumed the rally higher and near term, while pullbacks stay above 7389.26, and more importantly above 7096.6, expect FTSE to extend higher. A break above Minor wave 1 at 7533.7 is needed to confirm the next leg higher has started. Until then, a double correction in Minor wave 2 can’t be ruled out. We don’t like selling the proposed pullback.

If FTSE breaks below 7389.26, this suggests the Index is still correcting within Minor wave 2 as a 7 swing structure and this would open extension to the downside to the next 100% – 123.6% in 7 swing. In the event that this happens, the Index remains favored to continue the rally higher again after the 7 swing correction is completed as far as pivot at 7096.6 low remains intact.

FTSE 1 Hour Elliott Wave Chart 05/23/2017
Ayoub Ben Rejeb غير متواجد حالياً  
رد مع اقتباس
عضو نشيط
 
تاريخ التسجيل: Dec 2013
الدولة: Tunisia
المشاركات: 282
خبرة السوق: أكثر من 5 سنوات
معدل تقييم المستوى: 11
Ayoub Ben Rejeb is on a distinguished road
افتراضي رد: Elliott Wave Analysis by EWF
70#
24 - 05 - 2017, 12:20 PM
ES_F Elliott Wave View: Ending Impulse

Short Term Elliott Wave view in ES_F suggests the rally to 2403.75 ended Minor wave A. Minor wave B unfolded as an Expanded Flat Elliott Wave structure where Minute wave ((a)) ended at 2379, Minute wave ((b)) ended at 2404.5, and Minute wave ((c)) of B ended at 2344.5. After ending the pullback, the Index started a new leg higher and the rally from 2344.5 low looks to be unfolding as a 5 waves Elliott Wave impulse structure where Minutte wave (i) ended at 2375, Minutte wave (ii) ended at 2361, Minutte wave (iii) ended at 2388 and Minutte wave (iv) ended at 2378. Minutte wave (v) is in progress and the Index has scope to extend higher towards 2404.2 – 2410.5 area and this last push higher should also end Minutte wave (a).

Once Minutte wave (a) is complete, the Index is expected to pullback within Minutte wave (b) in 3, 7, or 11 swing to correct cycle from 5/18 low (2344.7) before the rally resumes again. Ideally the last push higher in Minutte wave (v) of (a) breaks above the previous peak at 2404.5 as a break above that level will give confirmation that the Index has started the next leg higher. If Minutte wave (a) can end above 2404.5, there’s a better chance that Minutte wave (b) pullback can hold above 2344.7 for the next leg higher. We don’t like selling the proposed pullback and expect buyers to appear again once Minutte wave (b) pullback is complete at later stage, provided that pivot at 2344.7 low remains intact.

ES_F 1 Hour Elliott Wave Chart 05/24/2017

Ayoub Ben Rejeb غير متواجد حالياً  
رد مع اقتباس


إضافة رد

الكلمات الدلالية (Tags)
commodity, elliott wave, forex, stocks


جديد مواضيع منتدى تداول العملات العام

المواضيع المتشابهه
الموضوع كاتب الموضوع المنتدى مشاركات آخر مشاركة
elliott wave Nnana123 منتدى تداول العملات العام 6 11 - 04 - 2015 07:07 PM


08:08 AM