• 12:23 مساءاً


Elliott Wave Analysis by EWF

إضافة رد
Like Tree17Likes

أدوات الموضوع
عضو نشيط
 
تاريخ التسجيل: Dec 2013
الدولة: Tunisia
المشاركات: 282
خبرة السوق: أكثر من 5 سنوات
معدل تقييم المستوى: 13
Ayoub Ben Rejeb is on a distinguished road
افتراضي رد: Elliott Wave Analysis by EWF
291#
09 - 08 - 2018, 03:13 PM
OIL Elliott Wave Analysis: Extending to the Downside

Oil ticker symbol: CL_F short-term Elliott wave analysis suggests that the bounce to $70.44 high ended intermediate wave (2). The internals of that bounce took place as Elliott wave double correction where Minor wave W ended in 3 swings at $69.92. From there, the pullback to $68.26 completed the Minor wave X in 3 swings. Then a bounce higher to $70.44 high ended Minor wave Y in another 3 swings & also completed Intermediate wave (2).

Down from there, the decline is taking place as Elliott wave impulse within intermediate wave (3) lower with the sub-division of 5 waves structure in Minor wave 1, 3 & 5. The initial decline from $70.44 high to $66.92 low ended Minor wave 1 of (3). The lesser degree cycles within that decline also unfolded in 5 waves structure & ended Minute wave ((i)) at $69.91. Minute wave ((ii)) ended at $70.22, Minute wave ((iii)) ended at $67.31 low, Minute wave ((iv)) bounce ended at $68.15 and Minute wave ((v)) of 1 ended at $66.92 low. Above from there, the bounce to $69.92 high ended Minor wave 2.

The internals of Minor wave 2 unfolded in 3 swings as Elliott wave zigzag correction where Minute wave ((a)) ended in 5 waves at $69.36. Minute wave ((b)) ended at $67.87 low and the bounce to $69.92 high ended Minute wave ((c)) of 2. Down from there, Minor wave 3 remain in progress in another 5 waves and as far as bounces fail below $69.92 high and more importantly the pivot from $70.44 high stays intact instrument is expected to see more downside. We don’t like buying it as the right side tag is lower.

OIL 1 Hour Elliott Wave Chart
Ayoub Ben Rejeb غير متواجد حالياً  
رد مع اقتباس

عضو نشيط
 
تاريخ التسجيل: Dec 2013
الدولة: Tunisia
المشاركات: 282
خبرة السوق: أكثر من 5 سنوات
معدل تقييم المستوى: 13
Ayoub Ben Rejeb is on a distinguished road
افتراضي رد: Elliott Wave Analysis by EWF
292#
14 - 08 - 2018, 05:49 PM
DAX Elliott Wave Analysis: Bounce Can be Temporary

DAX short-term Elliott wave analysis suggests that the rally to 12882.05 high ended Minor wave X bounce. The internals of that bounce unfolded as Elliott wave double three structure where Minute wave ((w)) ended at 12640.87. Minute wave ((x)) ended at 12468.68 and Minute wave ((y)) of X ended at 12882.05 high. Down from there, the decline is showing the overlapping price action suggesting that the decline in Minor wave Y is taking place as 3 wave corrective sequence i.e either ((w)),((x)),((y)) or ((w)),((x)),((y)),((x)),((z)) structure in Minute degree.

The initial decline from 12882.05 high is unfolding as Elliott wave zigzag correction in Minute wave ((w)) lower. Where minutte wave (a) ended in 5 waves structure at 12494 low. Up from there, the bounce to 12740.12 high ended Minutte wave (b) bounce in 3 swings. Decline from there is taking place in another 5 waves structure & reached the 12338.65-12245.56 100%-123.6% Fibonacci extension area of (a)-(b) to end Minutte wave (c) of ((w)). And soon, the index is expected to do a Minute wave ((x)) bounce in 3, 7 or 11 swings against 12882.05 high before further decline in Minute wave ((y)) of Y is seen. We don’t like selling it.

DAX 1 Hour Elliott Wave Chart
Ayoub Ben Rejeb غير متواجد حالياً  
رد مع اقتباس
عضو نشيط
 
تاريخ التسجيل: Dec 2013
الدولة: Tunisia
المشاركات: 282
خبرة السوق: أكثر من 5 سنوات
معدل تقييم المستوى: 13
Ayoub Ben Rejeb is on a distinguished road
افتراضي رد: Elliott Wave Analysis by EWF
293#
16 - 08 - 2018, 05:42 PM
GBPUSD Elliott Wave View: Calling For More Downside

GBPUSD short-term Elliott wave view suggests that the rally to 1.3215 high ended Minor wave 2 bounce. Down from there, Minor wave 3 is taking place as impulse structure with lesser degree cycles are showing sub-division of 5 waves structure lower in it’s each leg lower i.e Minute wave ((i)), ((iii)) & ((v)). While the sub-division in Minute wave ((ii)) & ((iv)) unfolded in 3 wave corrective sequence.

Down from 1.3215 high, the initial decline to 1.3081 low ended Minute wave ((i)) in 5 waves. Up from there, the bounce to 1.3172 high ended Minute wave ((ii)) in 3 swings as Elliott wave zigzag. Below from there, the decline to 1.2722 low unfolded in 5 waves & ended Minute wave ((iii)). Above from there, the bounce to 1.2826 high ended Minute wave ((iv)) in 3 swings as zigzag. Near-term focus remain towards 1.2695-1.2654 inverse 123.6%-161.8% of Minute wave ((iv)) to end Minute wave ((v)) of 3. Afterwards, the pair is expected to do a Minor wave 4 bounce in 3, 7 or 11 swings before further downside is seen. In case of further extension in Minute wave ((v)) of 3, pair can see 61.8%-76.4% Fibonacci extension area of Minute ((i))+((iii)) at 1.2521-1.2448 area as well before bounce in Minor wave 4 takes place. We don’t like buying it and prefer more downside against 1.3215 high in the first degree.

GBPUSD 1 Hour Elliott Wave Chart
Ayoub Ben Rejeb غير متواجد حالياً  
رد مع اقتباس
عضو نشيط
 
تاريخ التسجيل: Dec 2013
الدولة: Tunisia
المشاركات: 282
خبرة السوق: أكثر من 5 سنوات
معدل تقييم المستوى: 13
Ayoub Ben Rejeb is on a distinguished road
افتراضي رد: Elliott Wave Analysis by EWF
294#
16 - 08 - 2018, 05:52 PM
AUDUSD Elliott Wave View: More Downside Is Expected

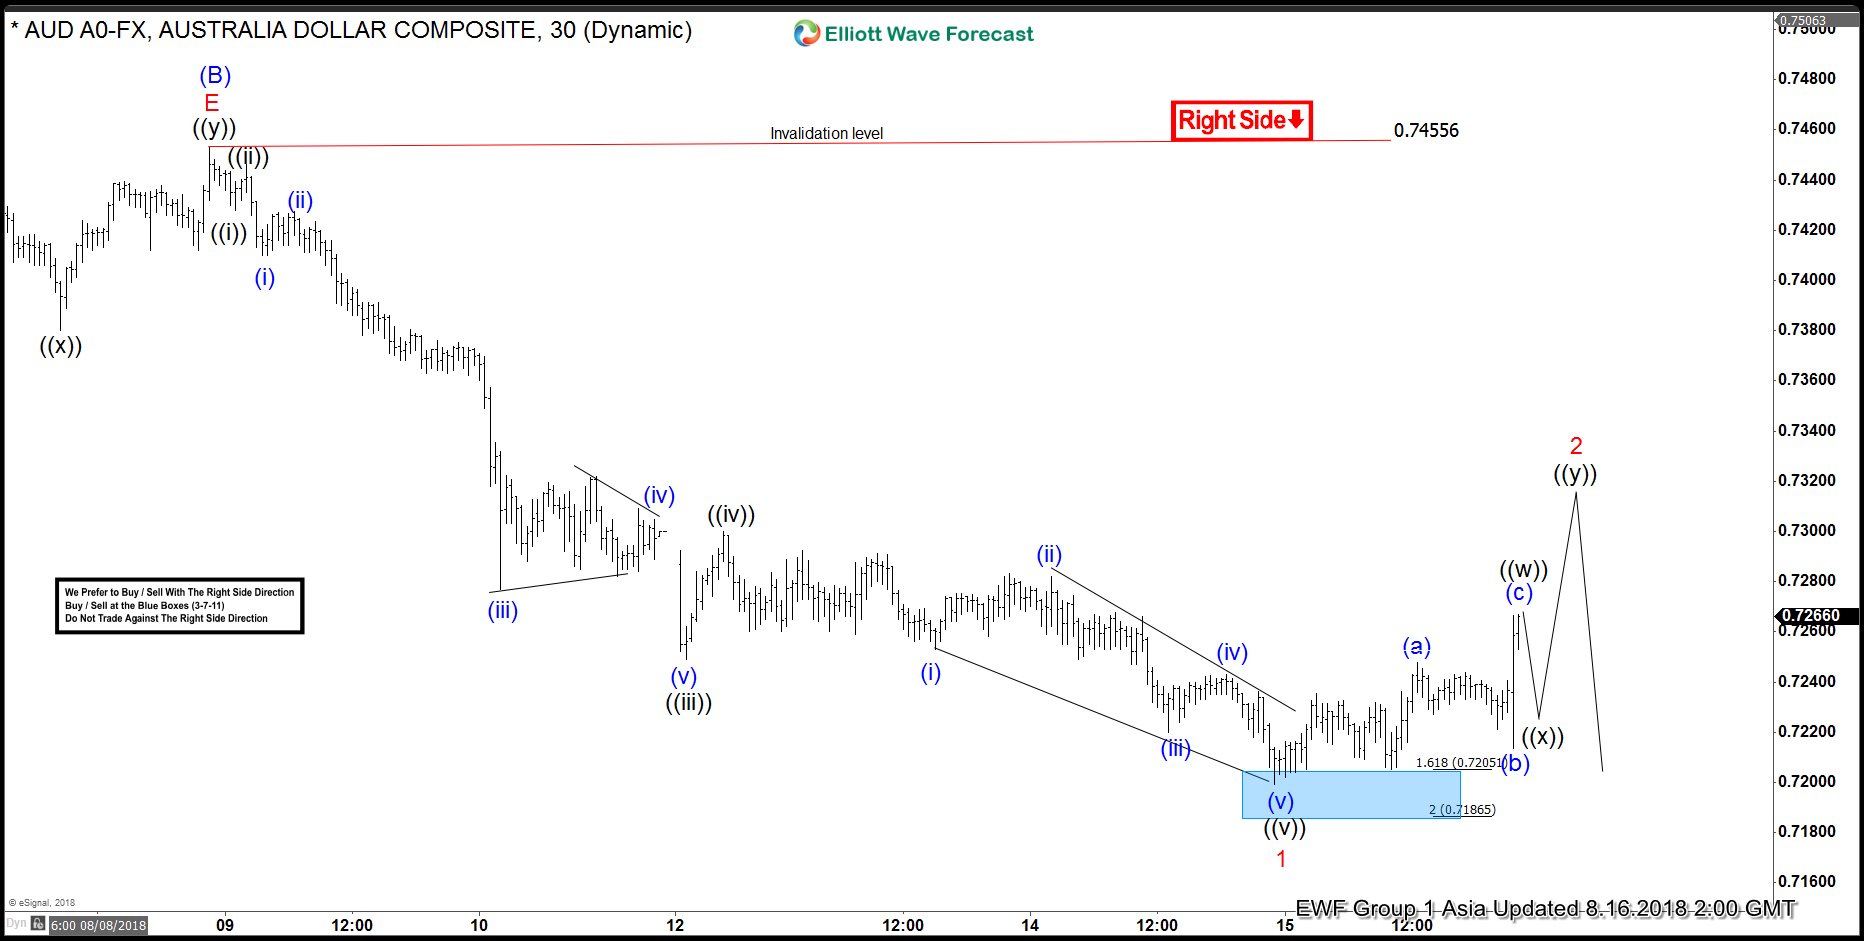
AUDUSD short-term Elliott wave view suggests that the bounce to 0.7455 high ended intermediate wave (B). Down from there, the pair has broken to new lows confirming the intermediate wave (C) lower. The internals of the decline is unfolding as impulse where Minor wave 1, 3 & 5 are expected to unfold in 5 waves structure. While Minor wave 2 & 4 can be can be any 3 wave corrective pattern i.e either double, triple three etc.

Down from 0.7455 high, Minor wave 1 is proposed complete at 0.7201 low. The internals of that decline showing sub-division of 5 waves structure in lesser degree cycles. Where Minute wave ((i)) ended in 5 waves structure at 0.7431. The Minute wave ((ii)) bounce ended at 0.7445. Then Minute wave ((iii)) ended at 0.7249 low in lesser degree 5 waves structure. Up from there, the bounce to 0.7299 high ended Minute wave ((iv)). Below from there, the decline to 0.7201 low ended Minute wave ((v)) in lesser degree 5 waves structure and also completed Minor wave 1 of (C). Above from there, the pair is doing a Minor wave 2 recovery & expected to fail in 3, 7 or 11 swings as far as a pivot at 0.7455 high stays intact for further downside. We don’t like buying the pair & prefer more downside against 0.7455 high.

AUDUSD 1 Hour Elliott Wave Chart
Ayoub Ben Rejeb غير متواجد حالياً  
رد مع اقتباس
عضو نشيط
 
تاريخ التسجيل: Dec 2013
الدولة: Tunisia
المشاركات: 282
خبرة السوق: أكثر من 5 سنوات
معدل تقييم المستوى: 13
Ayoub Ben Rejeb is on a distinguished road
افتراضي رد: Elliott Wave Analysis by EWF
295#
22 - 08 - 2018, 01:44 PM
Dow Futures Elliott Wave View: Pullback Should Find Support

Short-term Elliott Wave view on YM_F (Dow Futures) suggests that the pullback to 24956 low ended Minor wave 4. Up from there, Index is rallying within Minor wave 5 to end a 5 waves up from 4/2/2018 low. Minute wave ((i)) of 5 is currently in progress with internal subdivision as an impulse structure, This suggests lesser degree cycles in the direction of trend should unfold in 5 waves structure, i.e Minutte wave (i), (iii) & (v). On the other hand, the sub-division of lesser degree cycles against the trend should unfold in 3 waves corrective sequence, i.e. Minutte wave (ii) & (iv).

Up from 24956, Minutte wave (i) ended at 25326, Minutte wave (ii) ended at 25243, Minutte wave (iii) ended at 25657, Minutte wave (iv) ended at 25506, and Minutte wave (v) remains in progress towards 25828 – 26016. The move higher should also complete Minute wave ((ii)). Index should then pullback in Minute wave ((ii)) to correct cycle from 8/15/2018 low before the rally resumes. We don’t like selling the proposed pullback and expect dips to find support in 3, 7, or 11 swing as far as pivot at 24956 low stays intact.

Dow Futures 1 Hour Elliott Wave Chart
Ayoub Ben Rejeb غير متواجد حالياً  
رد مع اقتباس
عضو نشيط
 
تاريخ التسجيل: Dec 2013
الدولة: Tunisia
المشاركات: 282
خبرة السوق: أكثر من 5 سنوات
معدل تقييم المستوى: 13
Ayoub Ben Rejeb is on a distinguished road
افتراضي رد: Elliott Wave Analysis by EWF
296#
29 - 08 - 2018, 05:32 PM
S&P500 Mini Futures: Extending Higher As Impulse

S&P500 Mini Futures ticker symbol: $ES_F short-term Elliott wave view suggests that the decline to $2803.34 low ended Minor wave 4 pullback. The internals of that pullback unfolded as Elliott wave zigzag correction. The lesser degree Minute wave ((a)) ended in 5 waves at $2820.5 low. Then the bounce to $2843.50 high ended Minute wave ((b)) bounce as a Flat correction. Down from there, the index completed the Minute wave ((c)) in another 5 waves at $2803.34 low.

Up from there, the rally higher is taking place as impulse structure with lesser degree cycles showing sub-division of 5 waves structure in each leg higher. It’s also important to note here that index is already into new all-time highs & both the sequence & right side tags are calling index for more upside. Above from $2803.34 low, the minute wave ((i)) ended in lesser degree 5 waves structure at $2874 high. The pullback to $2846.25 low ended Minute wave ((ii)). A rally from there unfolding in another 5 waves structure within Minute wave ((iii)) with lesser degree cycles in Minutte wave (i), (iii) & (v) expected to unfold in 5 waves structure. We don’t like selling the index and expect buyers to appear in 3, 7 or 11 swings against $2803.34 low in the first degree.

S&P500 Mini Futures 1 Hour Elliott Wave Chart
Ayoub Ben Rejeb غير متواجد حالياً  
رد مع اقتباس
عضو نشيط
 
تاريخ التسجيل: Dec 2013
الدولة: Tunisia
المشاركات: 282
خبرة السوق: أكثر من 5 سنوات
معدل تقييم المستوى: 13
Ayoub Ben Rejeb is on a distinguished road
افتراضي رد: Elliott Wave Analysis by EWF
297#
30 - 08 - 2018, 05:32 PM
NZDUSD Elliott Wave Analysis: Double Correction Taking Place

NZDUSD short-term elliott wave analysis suggests that the decline to 0.6543 low ended Minor wave 1. The internals of that decline unfolded as impulse structure with lesser degree Minute wave ((i)), ((iii)) & ((v)) unfolded in 5 waves structure. Above from there, Minor wave 2 bounce is taking place as double correction higher with lesser degree cycles showing sub-division of 3 wave structure its each leg higher.

Up from 0.6543 low, the rally to 0.6719 high ended Minute wave ((w)) of 2. The internals of that rally also unfolded as double three structure where Minutte degree wave (w) ended at 0.6639. Minutte wave (x) pullback ended at 0.6609 & Minutte (y) of ((w)) ended at 0.6719 high. From there, the pullback to 0.6616 low ended Minute wave ((x)) of 2 as a Flat structure. Near-term, as far as dips remain above there, expect pair to resume the next leg higher in Minute wave ((y)) of 2 looking for 0.6795-0.6835, which is the 100%-123.6% Fibonacci extension area of Minute wave ((w))-((x)) to end Minor wave 2 bounce. We don’t like buying the pair.

NZDUSD 1 Hour Elliott Wave Chart
NZDUSD Elliott Wave Analysis: Double Correction Taking Place
Ayoub Ben Rejeb غير متواجد حالياً  
رد مع اقتباس
عضو نشيط
 
تاريخ التسجيل: Dec 2013
الدولة: Tunisia
المشاركات: 282
خبرة السوق: أكثر من 5 سنوات
معدل تقييم المستوى: 13
Ayoub Ben Rejeb is on a distinguished road
افتراضي رد: Elliott Wave Analysis by EWF
298#
31 - 08 - 2018, 05:54 PM
EURJPY Elliott Wave View: Ended 5 Waves Advance

EURJPY short-term Elliott wave view suggests that the decline to 124.87 low ended intermediate wave (2) pullback of a leading diagonal structure from 5/29/2018 cycle. Above from there, the rally higher is taking place as Elliott wave zigzag structure within intermediate wave (3) of a diagonal. In a zigzag ABC structure, lesser degree cycles should show sub-division of 5-3-5 structure i.e Minor wave A unfolds in 5 waves either impulse or a leading diagonal, Minor wave B unfolds in 3 swings corrective structure. Whereas Minor wave C unfolds in another 5 waves structure either impulse or Ending diagonal structure.

In EURJPY’s case, the rally higher from 124.87 low unfolded as 5 waves impulse structure in Minor wave A. Up from 124.87 the rally higher to 126.49 high ended Minute wave ((i)) in 5 waves structure. Down from there the pullback to 125.55 low ended Minute wave ((ii)) pullback. A rally higher from there to 130.275 high ended Minute wave ((iii)) with another lesser degree 5 waves structure. Below from there, a pullback to 129.55 low ended Minute wave ((iv)). Finally, a rally to 130.86 high ended Minute wave ((v)) & also completed Minor wave A. Currently Minor wave B pullback remains in progress in 3, 7 or 11 swings to correct the cycle from 124.87 low before the rally resumes, provided the pivot at 124.87 low stays intact. We don’t like selling it.

EURJPY 1 Hour Elliott Wave Chart
Ayoub Ben Rejeb غير متواجد حالياً  
رد مع اقتباس
عضو نشيط
 
تاريخ التسجيل: Dec 2013
الدولة: Tunisia
المشاركات: 282
خبرة السوق: أكثر من 5 سنوات
معدل تقييم المستوى: 13
Ayoub Ben Rejeb is on a distinguished road
افتراضي رد: Elliott Wave Analysis by EWF
299#
31 - 08 - 2018, 06:06 PM
Market Participants Betting on Nafta Deal between US and Canada

The Canadian Dollar strengthened to a two month high against US Dollar earlier this week. Market participants seem to bet on possible inclusion of Canada in a new Nafta pact. The U.S. has just concluded a successful bilateral talk with Mexico on Monday. Under the new agreement, cars need to have 75% of their content originate in the U.S and Mexico. The current Nafta requires 62.5% originate within North America. Under the new deal, 40-45% of auto content need to be made by workers who make more than $16 per hour, favoring the U.S. and Canada.

President Trump has threatened to put 25% tariffs on Canadian-made cars if a three-way deal can’t be reached. The major disagreement between Canada and U.S. is Canada’s insistence that the dairy supply management system is not open for negotiation. Trump has repeatedly said Canadian tariffs on some dairy products are unfair for U.S. producers. However, Prime Minister Trudeau on Wednesday has defended the supply management system that controls production of some Canadian farm products. The dairy issue is a difficult one for Prime Minister Justin Trudeau. The majority of domestic dairy industry is in Quebec and Ontario, and if they cave in the U.S. demands, they risk losing a lot of votes.

If a deal can be reached, the Bank of Canada can continue to focus on the domestic economy without worrying about trade disruption. Trump told reporters at White House on Wednesday that talks with Canada is going well. “They want to be part of the deal. And we gave till Friday and I think we’re probably on track.” Earlier this week Canadian Prime Minister Justin Trudeau said Canada is trying to reach agreement with the U.S. this week but won’t sacrifice its goal of getting the “right deal.” Talks with Canada should continue through the end of the week with aim to include Canada in trilateral deal. If the deal is successful, the Canadian Dollar may rally a lot further.

USDCAD Short Term Elliott Wave Sequence


USDCAD shows a 5 swing sequence from 6.28.2018 high, favoring further downside while rally stays below 8/13 high (1.3178). A 5 swing sequence is part of 7 swing WXY or also often referred to as double correction. The structure calls for further downside to 1.265 – 1.275 area as far as current rally in swing #6 fails below 1.3178. A successful outcome of the Nafta talk this week could cause pair to extend lower as the chart is calling.
Ayoub Ben Rejeb غير متواجد حالياً  
رد مع اقتباس


إضافة رد

الكلمات الدلالية (Tags)
commodity, elliott wave, forex, stocks


جديد مواضيع منتدى تداول العملات العام

المواضيع المتشابهه
الموضوع كاتب الموضوع المنتدى مشاركات آخر مشاركة
elliott wave Nnana123 منتدى تداول العملات العام 6 11 - 04 - 2015 07:07 PM


12:23 PM