• 12:19 مساءاً


Elliott Wave Analysis by EWF

إضافة رد
Like Tree17Likes

أدوات الموضوع
عضو نشيط
 
تاريخ التسجيل: Dec 2013
الدولة: Tunisia
المشاركات: 282
خبرة السوق: أكثر من 5 سنوات
معدل تقييم المستوى: 13
Ayoub Ben Rejeb is on a distinguished road
افتراضي رد: Elliott Wave Analysis by EWF
281#
05 - 07 - 2018, 01:41 PM
SPX Elliott Wave Analysis: Calling Correction Lower

SPX short-term Elliott wave analysis suggests that the rally from 4/02/2018 low to $2792.25 ended the intermediate wave (1). Down from there, correction against that cycle remains in progress in 3, 7 or 11 swing structure. Also, it’s important to note here that the decline from $2792.25 peak shows an overlapping price action thus suggesting that the correction is taking place in a corrective manner i.e either Double three or Triple three structure.

Down from $2792.25, Minor wave W unfolded as a double three structure with a combination of 3,3,3 swings in each leg. Minute wave ((w)) of W ended at $2743.10, Minute wave ((x)) of W ended at $2774.86 and Minute wave ((y)) of W ended at $2698.67 low. Up from there, Minor wave X bounce remains in progress to correct cycle from 6/13 high ($2792.25) as a Zigzag structure where Minute wave ((a)) ended at $2746.09 and Minute wave ((b)) remains in progress as a running triangle structure. Near-term focus remains towards $2745.32-$2756.36, which is the 50%-61.8% Fibonacci retracement area of the cycle coming from $2792.25 high to complete Minute wave ((c)) of X. Afterwards, the index is expected to continue lower in Minor wave Y to correct cycle from 4/02/2018 low. We don’t like selling the proposed pullback.

SPX 1 Hour Elliott Wave Chart
Ayoub Ben Rejeb غير متواجد حالياً  
رد مع اقتباس

عضو نشيط
 
تاريخ التسجيل: Dec 2013
الدولة: Tunisia
المشاركات: 282
خبرة السوق: أكثر من 5 سنوات
معدل تقييم المستوى: 13
Ayoub Ben Rejeb is on a distinguished road
افتراضي رد: Elliott Wave Analysis by EWF
282#
10 - 07 - 2018, 06:19 PM
EURJPY Elliott Wave Analysis: Pullback can Provide Buying Opportunity

EURJPY short-term Elliott wave analysis suggests that the decline to $126.63 on 6/19 low ended intermediate wave (2) pullback. Up from there, intermediate wave (3) remains in progress as Elliott wave impulse. The internals of Minor wave 1 is unfolding as a leading diagonal with sub-division of 5-3-5-3-5. Up from $126.63 low, Minute wave ((i)) ended in 5 waves at $128.84. Minute wave ((ii)) pullback ended in 3 swings as a double three Elliott Wave structure at $127.12 low. Then rally from there ended Minute wave ((iii)) in another 5 waves at $129.5 high. Down from there, the pullback to $128.44 low ended Minute wave ((iv)) pullback as a Running Flat. Above from there, Minute wave ((v)) of 1 remains in progress in another 5 waves structure. The cycle looks mature but pair can extend higher 1 more time before it completes Minor wave 1. Afterwards, the pair is expected to do a pullback in Minor wave 2 in 3, 7 or 11 swings to correct cycle from $126.63 low before further upside towards $132.30-$133.63 area is seen. We don’t like selling the proposed pullback.

EURJPY 1 Hour Elliott Wave Chart
القناص likes this.
Ayoub Ben Rejeb غير متواجد حالياً  
رد مع اقتباس
عضو نشيط
 
تاريخ التسجيل: Dec 2013
الدولة: Tunisia
المشاركات: 282
خبرة السوق: أكثر من 5 سنوات
معدل تقييم المستوى: 13
Ayoub Ben Rejeb is on a distinguished road
افتراضي رد: Elliott Wave Analysis by EWF
283#
11 - 07 - 2018, 01:07 PM
OIL Elliott Wave View: Providing Buying Opportunity Soon

OIL short-term Elliott Wave view suggests that the pullback to $63.39 on 6/18/2018 low ended primary wave ((4)). Up from there, the instrument rallied strongly to the upside and went on to make new high for the year. A rally from there took place in the form of an Impulse Elliott wave structure with extension with lesser degree oscillation showing the sub-division of 5 waves structure in each leg higher.

The internals of rally from $63.39 low ended Minor wave 1 in 5 waves at $66.53. Then the pullback to $64.34 low ended Minor wave 2 in 3 swings. Above from there, instrument rallied higher strongly in Minor wave 3 and ended another 5 waves at $74.46 high. Down from there the pullback to $72.51 low ended Minor wave 4. Then a rally to $75.27 high ended Minor wave 5 and also completed Intermediate wave (1) higher.

Below from there, the instrument is pulling back to correct cycle from 6/18 low ($63.39) in Intermediate wave (2) and expected to find buyers in 3, 7 or 11 swings. Currently, the instrument already did a 3 waves pullback in Minor wave W at $72.14, which is located inside $72.39-$71.82 blue box area and bounced higher. However, while it stays below the $75.27 high, the instrument is expected to do a double correction in 7 swings lower towards $70.74-$69.53, which is 123.6%-161.8% Fibonacci extension area of Minor wave W-X before it resumes the upside provided the pivot from $63.39 low stays intact. We don’t like selling it and expect Oil to stay supported as far as a pivot at $63.39 low is holding.

OIL 1 Hour Elliott Wave Chart
القناص likes this.
Ayoub Ben Rejeb غير متواجد حالياً  
رد مع اقتباس
عضو نشيط
 
تاريخ التسجيل: Dec 2013
الدولة: Tunisia
المشاركات: 282
خبرة السوق: أكثر من 5 سنوات
معدل تقييم المستوى: 13
Ayoub Ben Rejeb is on a distinguished road
افتراضي رد: Elliott Wave Analysis by EWF
284#
12 - 07 - 2018, 01:37 PM
Elliott Wave Analysis: Is AUDUSD Ready to Resume Lower?

AUDUSD short-term Elliott Wave view suggests that the decline to $0.7308 low ended Intermediate wave (A) of a possible Zigzag structure coming from 6/06/2018 peak ($0.7676). Above from there, the 3 waves recovery to $0.7484 high ended Intermediate wave (B) bounce. The internals of that Intermediate wave (B) unfolded as Elliott Wave Zigzag correction where Minor wave A ended at $0.7424 high. Subdivision of Minor wave A of (B) unfolded as 5 waves where Minute wave ((i)) ended at $0.7342. Minute wave ((ii)) ended at $0.7312, Minute wave ((iii)) ended at $0.7404. Then Minute wave ((iv)) ended at $0.7368 and Minute wave ((v)) of A ended at $0.7424 high.

Down from there, Minor wave B ended at $0.7359 low. Up from there, Minor wave C of (B) ended at $0.7484 high with internals also unfolded in another 5 waves structure. Minute wave ((i)) ended at $0.7408. Minute wave ((ii)) ended at $0.7371, Minute wave ((iii)) ended at $0.7483. Then Minute wave ((iv)) ended at $0.7452 and Minute wave ((v)) of C ended at $0.7484 high. This rally also completed Intermediate wave (B) bounce there, after reaching the 100%-123.6% Fibonacci extension area of Minor A-B at $0.7475-$0.7503 area. Near-term, while bounces fail below there, expect pair to resume lower in Intermediate wave (C). However, a break below $0.7305 low remains to be seen to validate this view & until than a double correction higher in Intermediate wave (B) bounce can’t be ruled out. We don’t like buying it.

AUDUSD 1 Hour Elliott Wave Chart
القناص likes this.
Ayoub Ben Rejeb غير متواجد حالياً  
رد مع اقتباس
عضو نشيط
 
تاريخ التسجيل: Dec 2013
الدولة: Tunisia
المشاركات: 282
خبرة السوق: أكثر من 5 سنوات
معدل تقييم المستوى: 13
Ayoub Ben Rejeb is on a distinguished road
افتراضي رد: Elliott Wave Analysis by EWF
285#
13 - 07 - 2018, 05:57 PM
Elliott Wave Analysis: USDJPY Extending Higher As Impulse

USDJPY short-term Elliott Wave view suggests that the rally to 111.13 high ended Minute wave ((i)). Down from there, the pullback to 110.24 low ended Minute wave ((ii)). The internals of that pullback unfolded as a Flat Elliott Wave structure where Minutte wave (a) ended in lesser degree 3 swings at 110.77. Then bounce to 111.10 ended Minutte wave (b). And Minutte wave (c) of ((ii)) ended in 5 waves at $110.24 low.

Up from there, Minute wave ((iii)) remains in progress. And rally higher is showing the sub-division of 5 waves in lesser degree cycle suggesting an impulse structure. Above from $110.24 low, Minutte wave (i) of ((iii)) ended in 5 waves at 111.35. The pullback to 110.74 low ended Minutte (ii) of ((iii)). A rally higher from there is expected to complete Minutte wave (iii) of ((iii)) soon in another 5 waves in between 161.8%-200% Fibonacci extension area of Minutte wave (i)-(ii)) at 112.56 – 112.93. Afterwards, the pair is expected to do a pullback in Minutte wave (iv) of ((iii)) before another push higher is seen. We don’t like selling it. And as far as a pivot from 110.24 low holds pair is expected to see more upside.

USDJPY 1 Hour Elliott Wave Chart
القناص likes this.
Ayoub Ben Rejeb غير متواجد حالياً  
رد مع اقتباس
عضو نشيط
 
تاريخ التسجيل: Dec 2013
الدولة: Tunisia
المشاركات: 282
خبرة السوق: أكثر من 5 سنوات
معدل تقييم المستوى: 13
Ayoub Ben Rejeb is on a distinguished road
Smile رد: Elliott Wave Analysis by EWF
286#
31 - 07 - 2018, 02:42 PM
SPX Elliott Wave Analysis: Buying Opportunity Soon

SPX Short-term Elliott Wave analysis suggests that the pullback to $2691.80 low on 6.28.2018 ended intermediate wave (2). Above from there, the rally higher to $2848.03 peak ended Minor wave 1. The internals of that rally higher took the form as impulse Elliott wave structure where Minute wave (), ((ii)) & ((iii)) unfolded in 5 waves structure & wave ((ii)) & ((iv)) unfolded in 3 swings corrective sequence.

Up from $2691.8 low, the rally higher to $2743.26 high ended Minute wave () in 5 waves. The pullback to $2698.95 ended Minute wave ((ii)) and the rally higher to $2804.53 high ended Minute wave ((iii)) as 5 wave structure. From there, Minute wave ((iv)) pullback ended at $2789.24 low and the rally higher to $2848.03 peak ended Minute wave ((v)) which also completed Minor wave 1.

The Index is now correcting cycle from 6.28.2018 low within wave 2 in 3, 7 or 11 swings before further upside is seen. Near-term focus remains towards $2783.14-$2759.10, which is 100%-161.8% Fibonacci extension area of ((w))-((x)) to end the 3 swings pullback in Minor wave 2. Buyers should appear from the above area either for new highs or for 3 waves reaction higher at least. We don’t like selling it.

SPX 1 Hour Elliott Wave Chart
Ayoub Ben Rejeb غير متواجد حالياً  
رد مع اقتباس
عضو نشيط
 
تاريخ التسجيل: Dec 2013
الدولة: Tunisia
المشاركات: 282
خبرة السوق: أكثر من 5 سنوات
معدل تقييم المستوى: 13
Ayoub Ben Rejeb is on a distinguished road
افتراضي رد: Elliott Wave Analysis by EWF
287#
02 - 08 - 2018, 01:43 PM
Elliott Wave Analysis: OIL Starting The Next Leg Lower

OIL short-term Elliott wave analysis suggests that the bounce to $71.13 high ended primary wave ((B)) bounce against 7/03/2018 peak ($75.27). Primary wave ((C)) lower currently remains in progress as Elliott Wave impulse structure looking for more downside. Down from $71.13 high, the decline to $67.96 low ended intermediate wave (1) in 5 waves structure. Above from there, the bounce to $70.43 high ended intermediate wave (2). The internals of Intermediate wave (2) unfolded as Elliott Wave double three structure where the initial rally to $69.92 completed Minor wave W of (2) as a Flat.

The subsequent pullback to $68.26 low ended Minor wave X of (2) as Elliott Wave Zigzag correction. Finally, the third leg higher in Minor wave Y of (2) ended at $69.92 high as Zigzag structure. Down from there, Intermediate wave (3) lower is in progress as an impulse and started nesting with Minor wave 1 ended in 5 waves at $67.31 low. Up from there, Minor wave 2 recovery remains in progress in 3, 7 or 11 swings & expected to fail below $70.43 high in first degree and against $71.13 in the second degree for more downside. As far as rally fails below 71.13, expect Oil to see further downside.

OIL 1 Hour Elliott Wave Chart
القناص likes this.
Ayoub Ben Rejeb غير متواجد حالياً  
رد مع اقتباس
عضو نشيط
 
تاريخ التسجيل: Dec 2013
الدولة: Tunisia
المشاركات: 282
خبرة السوق: أكثر من 5 سنوات
معدل تقييم المستوى: 13
Ayoub Ben Rejeb is on a distinguished road
افتراضي رد: Elliott Wave Analysis by EWF
288#
03 - 08 - 2018, 01:51 PM
NASDAQ Elliott Wave Analysis: Ready To Rally Higher?

NASDAQ futures: ticker symbol NQ_F short-term Elliott wave analysis suggests that the decline to $7167.37 low ended intermediate wave (2) pullback. The internals of that pullback unfolded as Elliott Wave Flat correction where Minor wave A ended at $7311.50 low. Above from there, the bounce to $7530 high ended Minor wave B bounce as Elliott wave Zigzag where Minute wave ((a)) ended at $7489.75 high, Minute wave ((b)) pullback ended at $7386.75 low and Minute wave ((c)) of B ended at $7530 high.

Down from there, the index declined in 5 waves lower within Minor wave C. The first leg lower Minute wave ((i)) ended at $7388.5. Up from there, the bounce to $7467 high ended Minute wave ((ii)) and then the decline to $7263.50 low ended Minute wave ((iii)). Minute wave ((iv)) bounce ended at $7309.25 and the last leg Minute wave ((v)) of C ended at $7167.37 low. This last leg also completed Intermediate wave (2) pullback. Near-term, while dips remain above $7167.37 low, expect the Index to do a nesting to resume the the next leg higher. A break above $7530 (irregular wave B) however is needed for final confirmation to avoid a double correction lower. We don’t like selling the index.

NASDAQ 1 Hour Elliott Wave Chart
Ayoub Ben Rejeb غير متواجد حالياً  
رد مع اقتباس
عضو نشيط
 
تاريخ التسجيل: Dec 2013
الدولة: Tunisia
المشاركات: 282
خبرة السوق: أكثر من 5 سنوات
معدل تقييم المستوى: 13
Ayoub Ben Rejeb is on a distinguished road
افتراضي رد: Elliott Wave Analysis by EWF
289#
08 - 08 - 2018, 05:21 PM
Dow Futures (YM_F) Elliott Wave View: Reacting Higher From Blue box

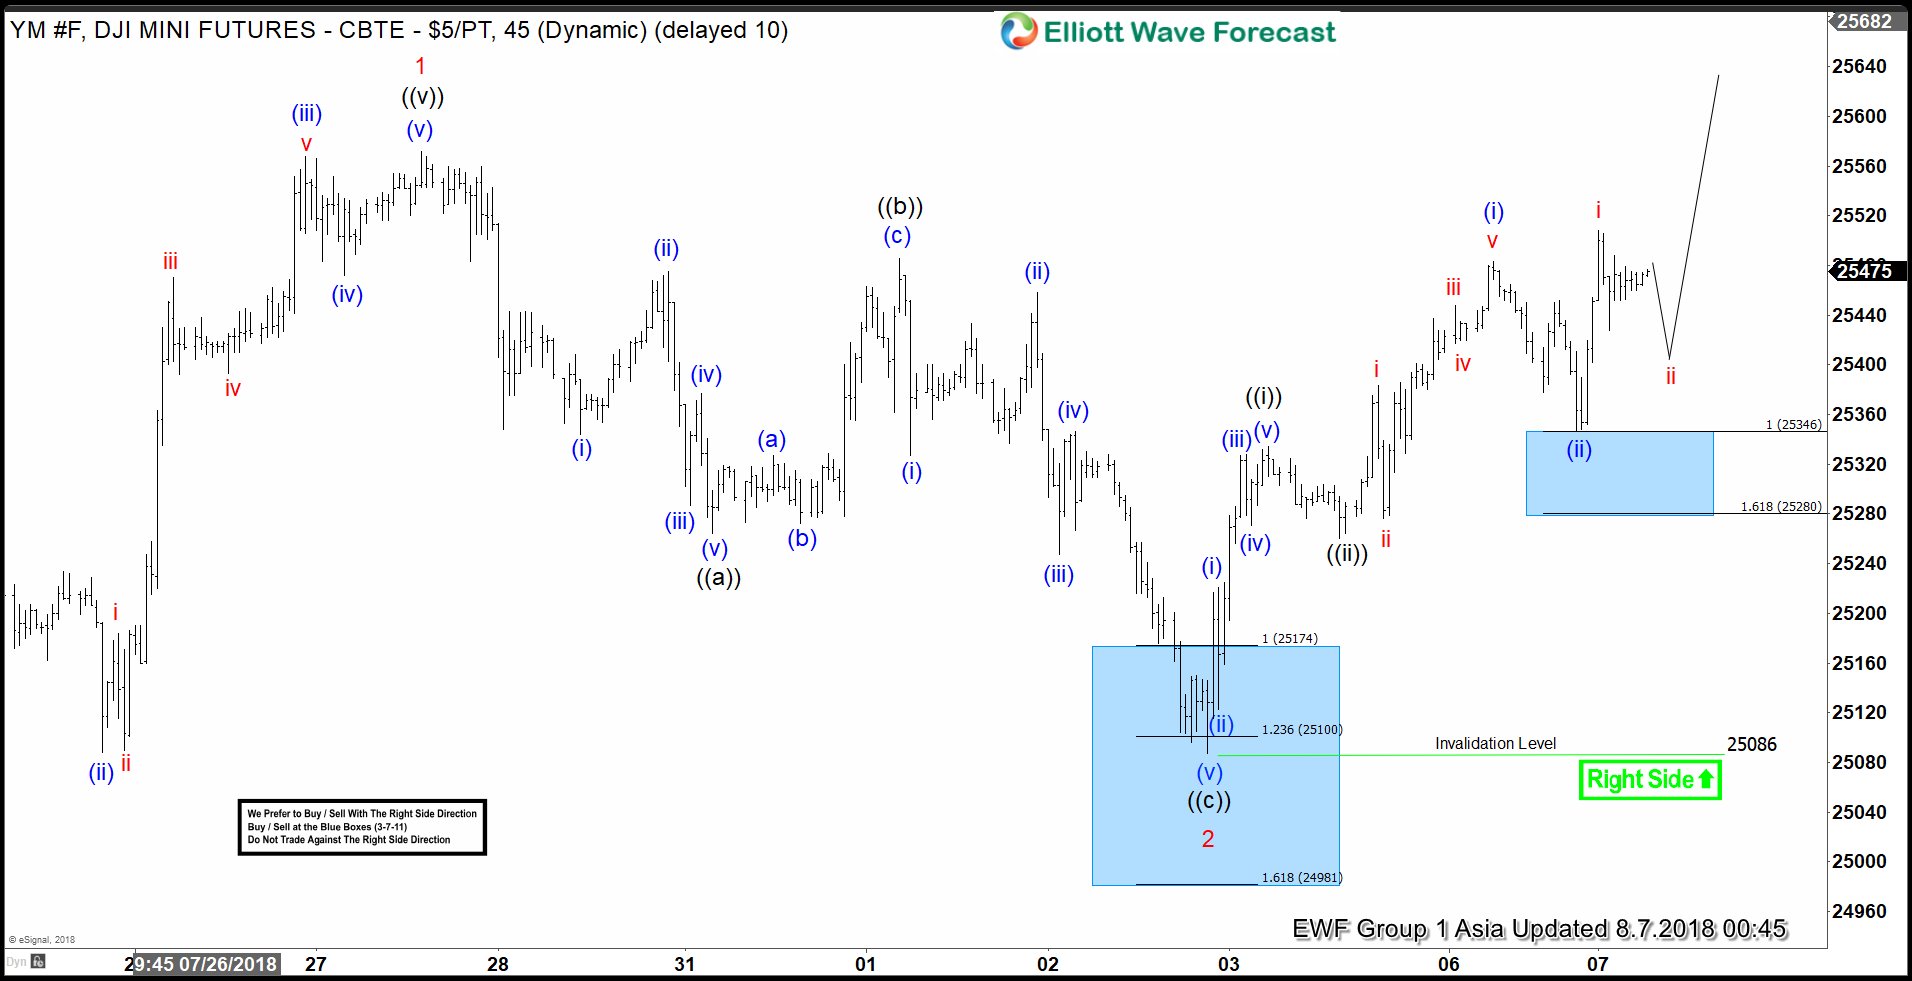
Dow Futures ticker symbol: YM_F short-term Elliott wave view suggests that the rally from 6/28/2018 low cycle to 25572 high on 7/27/2018 peak ended Minor wave 1. The internals of that rally higher took place as an impulse structure with sub-division of 5 waves structure in each leg higher. Down from there, the index corrected the 6/28/2018 cycle in 3 swings pullback & ended Minor wave 2 at 25086 low.

The internals of that pullback unfolded as Elliott wave Zigzag correction with the sub-division of 5-3-5 structure in Minute wave ((a)), ((b)), ((c)). Down from 7/27 peak, the decline to 25264 low ended Minute wave ((a)) in 5 waves structure. From there, the rally to 25486 high ended Minute wave ((b)) and the subsequent move lower to 25086 low ended Minute wave ((c)) of 2 in 5 waves structure. Minor wave 2 ended within the 25174 – 25100 area, which is 100%-123.6% Fibonacci extension of ((a))-((b)), as indicated by the blue box.

Up from 25086, the index is reacting higher in 3 swings so far and longs from blue box area should be risk-free (stop loss at break even) already. The right side tag, combined with the blue box, help to identify the right trading strategy. Near-term, as far as dips remain above 25086 low, the right side of the market remains to the upside. Expect the Index to resume the next extension higher in Minor wave 3, but a break above 25572 high remains to be seen for final confirmation and to avoid double correction lower in Minor wave 2 pullback. We don’t like selling it.

YM_F 1 Hour Elliott Wave Chart
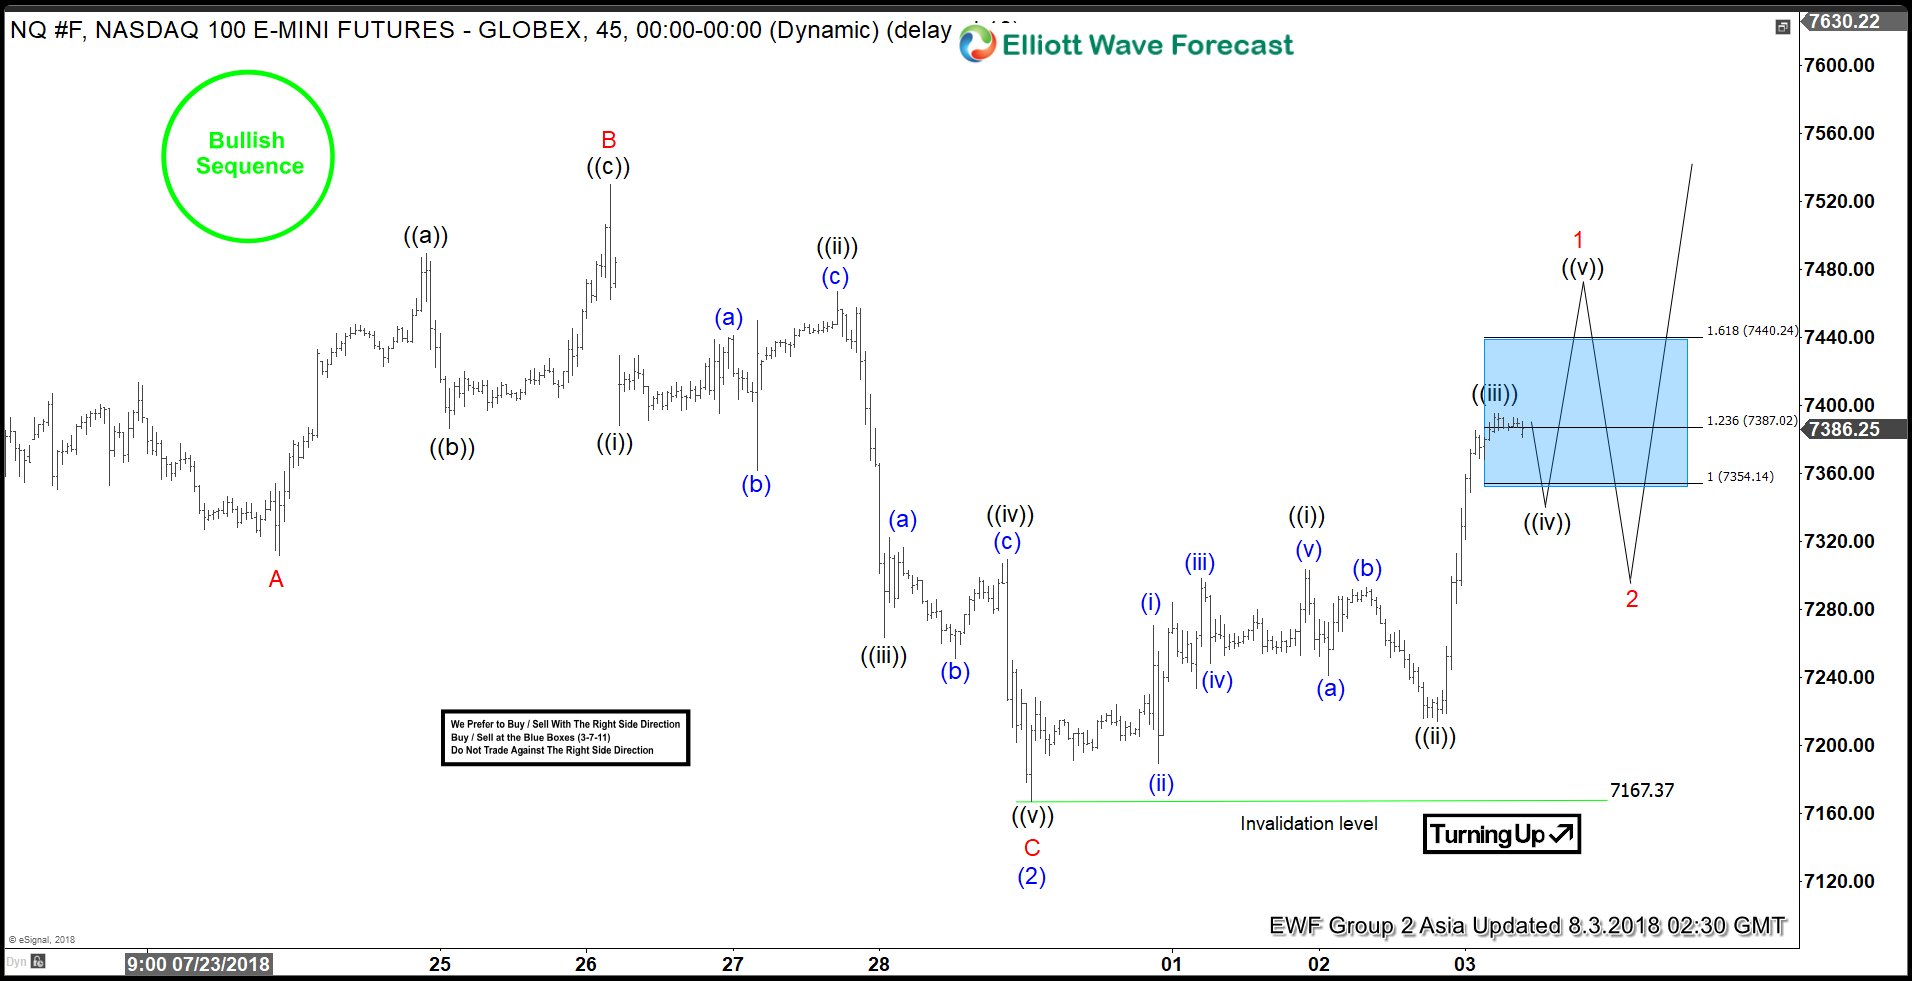
Ayoub Ben Rejeb غير متواجد حالياً  
رد مع اقتباس
عضو نشيط
 
تاريخ التسجيل: Dec 2013
الدولة: Tunisia
المشاركات: 282
خبرة السوق: أكثر من 5 سنوات
معدل تقييم المستوى: 13
Ayoub Ben Rejeb is on a distinguished road
افتراضي رد: Elliott Wave Analysis by EWF
290#
08 - 08 - 2018, 05:31 PM
GBPUSD Elliott Wave Analysis: Right Side Calling Lower

GBPUSD short-term Elliott Wave analysis suggests that the decline from 7/09/2018 peak (1.3361) is unfolding as Elliott wave zigzag when Minor wave A ended in 5 waves structure at 1.2956 low. Up from there, the bounce to 1.3214 high ended Minor wave B. The internals of that bounce unfolded as a Double three structure where Minute wave ((w)) ended at $1.3157. Minute wave ((x)) ended at 1.3070 low. And Minute wave ((y)) of B ended at 1.3214 high.

Down from there, Minor wave C remains in progress in another 5 waves. The internals of wave C is unfolding as an impulse & decline to 1.3081 ended Minute wave ((i)) in 5 waves. Up from there, the bounce to 1.3173 high ended Minute wave ((ii)) in 3 waves. Afterwards, pair declined lower in another 5 waves structure with lesser degree cycles showing sub-division of 5 waves structure. And ended Minute wave ((iii)) at 1.2918 low. Above from there, Minute wave ((iv)) is proposed complete at 1.2974 high. At this stage, a break below 1.2919 low remains to be seen for final confirmation and to avoid double correction in Minute wave ((iv)).

Near-term, while bounces fail below 1.2974 high and more importantly the pivot from 1.3214 high stays intact, expect pair to resume lower in Minute wave ((v)) before ending Minor wave C. The minimum extension area for Minute wave ((v)) i.e inverse 1.236%-161.8% Fibonacci extension area of Minute wave ((iv)) comes at 1.2906 – 1.2884. In case of further extension, Minute wave ((v))=((i)) target area can reach 1.2842 – 1.2810 before ending the zigzag structure & a bounce could then take place. We don’t like buying the pair as the right side tag is calling the pair lower.

GBPUSD 1 Hour Elliott Wave Chart
القناص likes this.
Ayoub Ben Rejeb غير متواجد حالياً  
رد مع اقتباس


إضافة رد

الكلمات الدلالية (Tags)
commodity, elliott wave, forex, stocks


جديد مواضيع منتدى تداول العملات العام

المواضيع المتشابهه
الموضوع كاتب الموضوع المنتدى مشاركات آخر مشاركة
elliott wave Nnana123 منتدى تداول العملات العام 6 11 - 04 - 2015 07:07 PM


12:19 PM