
رد: Elliott Wave Analysis by EWF
AUDUSD Elliott Wave View: More Upside
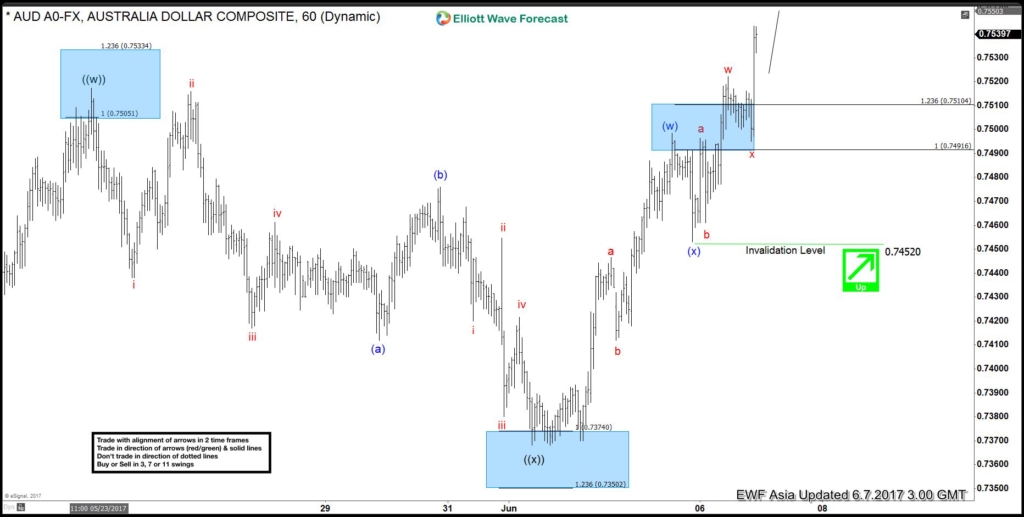
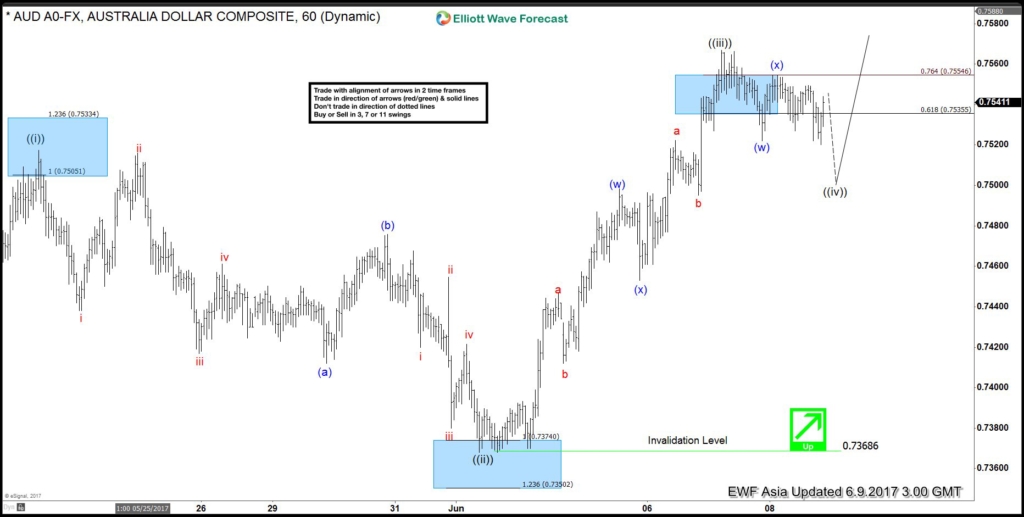
Short Term Elliott Wave view in AUDUSD suggests the rally from 5/9 low is unfolding as a double three Elliott Wave structure. Up from 5/9 (0.7325) low, Minute wave ((w)) ended at 0.7517 and Minute wave ((x)) ended at 0.7368. Pair has since broken above 0.7517, adding validity that the next leg higher has started.
From 0.7368 low, the rally is also unfolding as a double three Elliott Wave structure. Minutte wave (w) ended at 0.7498 and Minutte wave (x) ended at 0.7453. Near term, while pullbacks stay above 0.7452, but more importantly as far as pivot at 0.7368 stays intact, expect pair to extend higher towards 0.756 – 0.7607 area to end cycle from 5/9 low. We don’t like selling the pair and expect buyers to appear in any dips in 3, 7, or 11 swing provided that pivot at 0.7368 remains intact.
AUDUSD 1 Hour Elliott Wave View
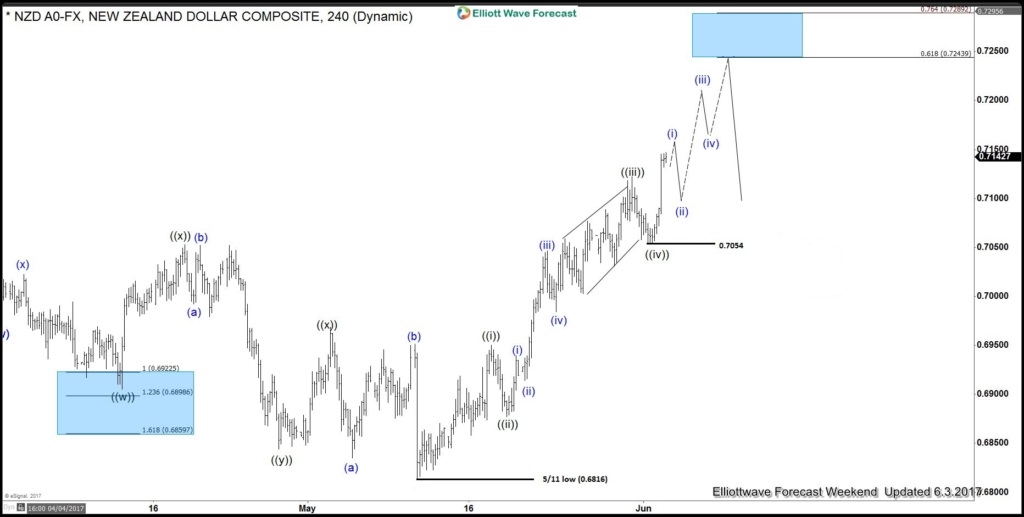


 ) ended at (0.6948), Minute wave ((ii)) pullback ended at (0.6880), Minute wave ((iii)) at 0.7121 peak, Minute wave ((iv)) pullback ended at (0.7054) low. Above from there Minute wave ((v)) of C or A already reached the minimum extension area in between inverse 1.236-1.618% extension area of previous wave ((iv)) already at 0.7135-0.7161 area. Which means cycle from 5/11 low (0.6816) is mature and pair can start the 3 waves pullback at any moment.
 المواضيع المتشابهه


 17Likes