• 11:18 صباحاً


Elliott Wave Analysis by EWF

إضافة رد
Like Tree17Likes

أدوات الموضوع
عضو نشيط
 
تاريخ التسجيل: Dec 2013
الدولة: Tunisia
المشاركات: 282
خبرة السوق: أكثر من 5 سنوات
معدل تقييم المستوى: 13
Ayoub Ben Rejeb is on a distinguished road
افتراضي رد: Elliott Wave Analysis by EWF
101#
15 - 06 - 2017, 12:49 PM
GBPJPY Elliott Wave Analysis: Resuming Lower

Short term GBPJPY Elliott Wave view suggests the decline from 5/10 high shows a 5 swing sequence, thus favoring more downside. Decline from 5/10 high is unfolding as a double three Elliott Wave structure. Down from 5/10 peak (148.11), Minor wave W ended at 141.47 and Minor wave X ended at 143.96. Minor wave Y is currently in progress and has scope to retest 4/16 low (135.58). Support can be seen at 135.7 – 137.3 area for at least 3 waves bounce.

Subdivision of Minor wave Y is proposed to be unfolding as a triple three Elliott Wave structure. Down from 6/1 peak (143.96), Minute wave ((w)) ended at 140.68, Minute wave ((x)) ended at 142.77, Minute wave ((y)) ended at 139.52 and Minute second wave ((x)) is proposed complete at 140.9. While near term bounce stays below 142.75, and more importantly below 143.95, expect pair to extend lower. We don’t like buying the pair.

GBPJPY 1 Hour Elliott Wave Chart 06/15/2017

Ayoub Ben Rejeb غير متواجد حالياً  
رد مع اقتباس

عضو نشيط
 
تاريخ التسجيل: Dec 2013
الدولة: Tunisia
المشاركات: 282
خبرة السوق: أكثر من 5 سنوات
معدل تقييم المستوى: 13
Ayoub Ben Rejeb is on a distinguished road
افتراضي رد: Elliott Wave Analysis by EWF
102#
16 - 06 - 2017, 02:23 PM
YM (Dow Futures) Elliott Wave Analysis 6.16.2017

Short term YM (Dow Futures) Elliott Wave view suggests the rally from 4/19 low is unfolding as a diagonal Elliott Wave structure where Minor wave 1 ended at 21010 (4/26), Minor wave 2 ended at 20474 (5/18), Minor wave 3 ended at 21270 (6/8), and Minor wave 4 ended at 21081 (6/8). Minor wave 5 is in progress and subdivided into a zigzag Elliott Wave structure. Up from 6/8 low, Minute wave ((a)) is expected to complete at 21360 – 21404. Index should then pullback in Minute wave ((b)) to correct cycle from 6/8 low before the rally resumes. We don’t like selling the proposed pullback. Buyers should appear once Minute wave ((b)) pullback is over in 3, 7, or 11 swing.

YM (Dow Futures) 1 Hour Elliott Wave Chart 06/16/2017


Ayoub Ben Rejeb غير متواجد حالياً  
رد مع اقتباس
عضو نشيط
 
تاريخ التسجيل: Dec 2013
الدولة: Tunisia
المشاركات: 282
خبرة السوق: أكثر من 5 سنوات
معدل تقييم المستوى: 13
Ayoub Ben Rejeb is on a distinguished road
افتراضي رد: Elliott Wave Analysis by EWF
103#
19 - 06 - 2017, 05:24 PM
Bullish Palladium Supporting Commodities

The world is hooked on ‘Palladium’ because of its uses as an industrial metal and catalyst, the consumers are mainly automobile producers as it’s widely used in gasoline-based engine cars to curb harmful emissions from vehicles. Palladium surged +34% this year on expectations that supply will lag demand for a sixth straight year, beating the rest of commodities, combined with last year gains it results in an impressive 95% rally.

The spot markets are trading above the futures market as it appears that there is a serious shortage of readily available physical bars for spot settlement, which helped the metal to make new 16-year high level of $910 on Friday, June 9. The futures for July expiration touched the peak of $891 the same day.

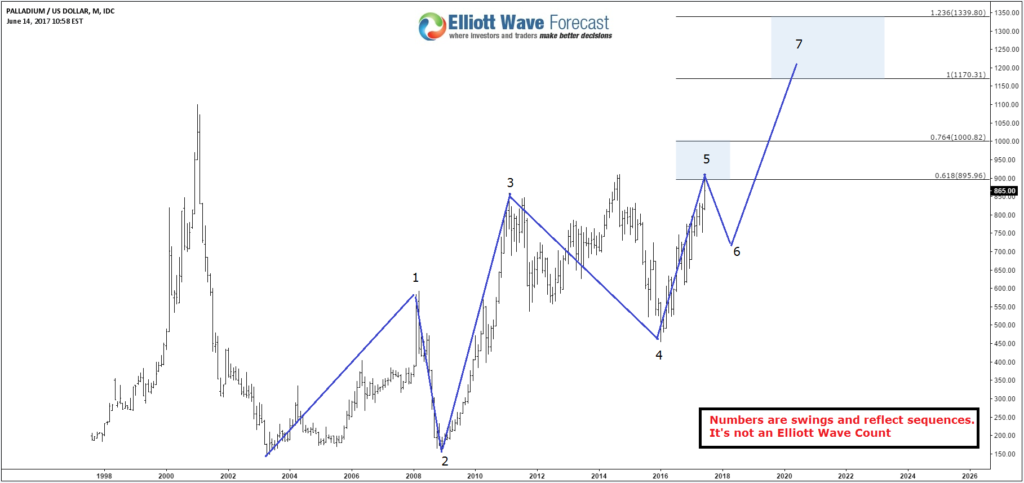
The recent break higher opened a new extension to the upside as palladium is now showing incomplete bullish 5 swing sequence from 2003 low, which is different from the usual Elliott Wave count as this sequence is part of the double three structure which suggest that a connector is in place between 2011 & 2016 as a flat correction and the 6th swing pullback should hold 2016 low for palladium to be able to resume it’s rally toward the next target around $1170 – $1340. The surprise move would happen if it’s doing a diagonal and currently is in the last 5th wave or the recent new high rally from 2016 lows is part of a flat from 2011 peak, so both these scenarios would result in a significant decline but until there is a sign of 2016 pivot breaking then the metal should remain supported and leading the commodities to the upside.

Palladium Monthly Chart

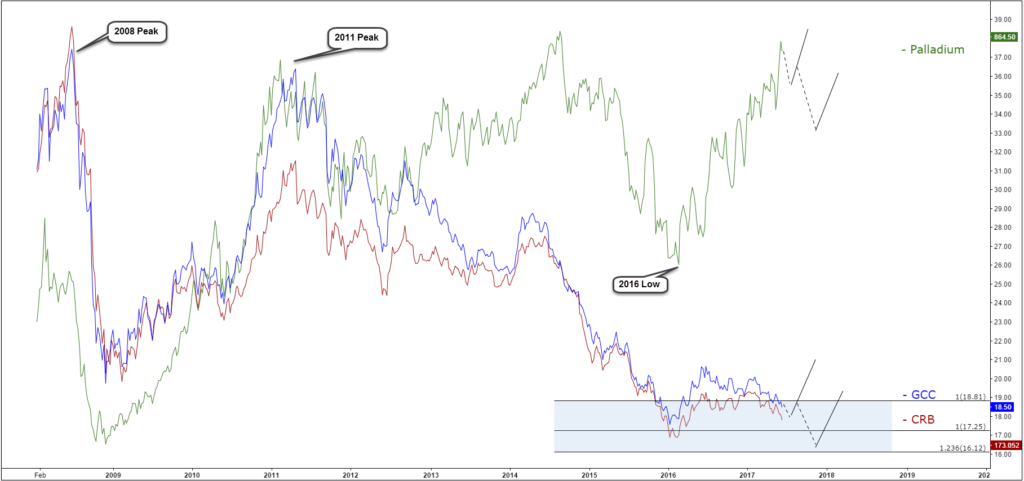
To compare Palladium to commodities, we added The WisdomTree Continuous Commodity Index Fund (GCC) and The Thomson Reuters/Jefferies CRB Index (TRJEFFCRB) as both are tracking multiple commodities and reflecting the overall trend which has been to the downside since 2011 peak. GCC index has already reached extreme area from 2008 & 2011 peaks suggesting that the bearish cycle is in the last stage even there could be still another leg lower in CRB & GCC which may or may not break the 2016 low. In fact that won’t make any big difference for Palladium as it already created enough separation from 2016 low, so it will be either doing a small correction against May 2017 low or a deeper pullback to correct 2016 cycle before rallying again.

GCC vs CRB vs Palladium

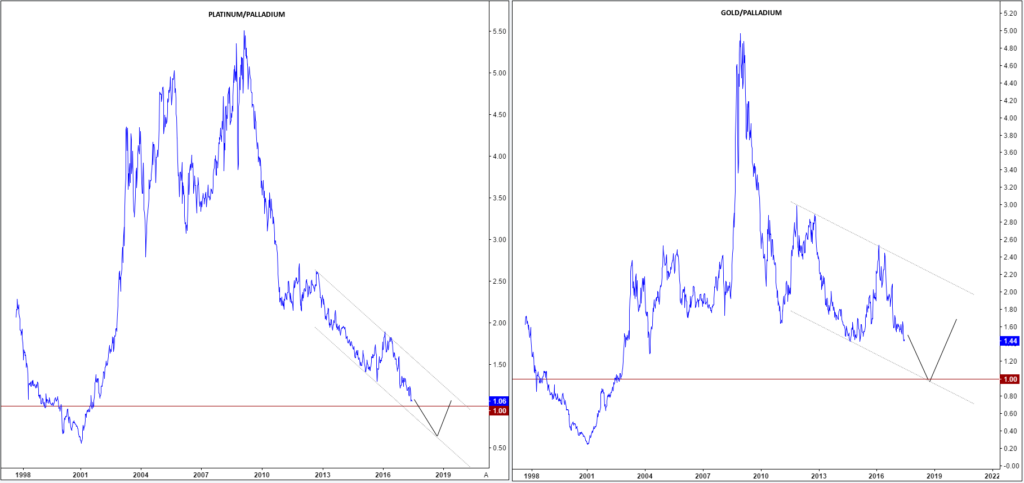
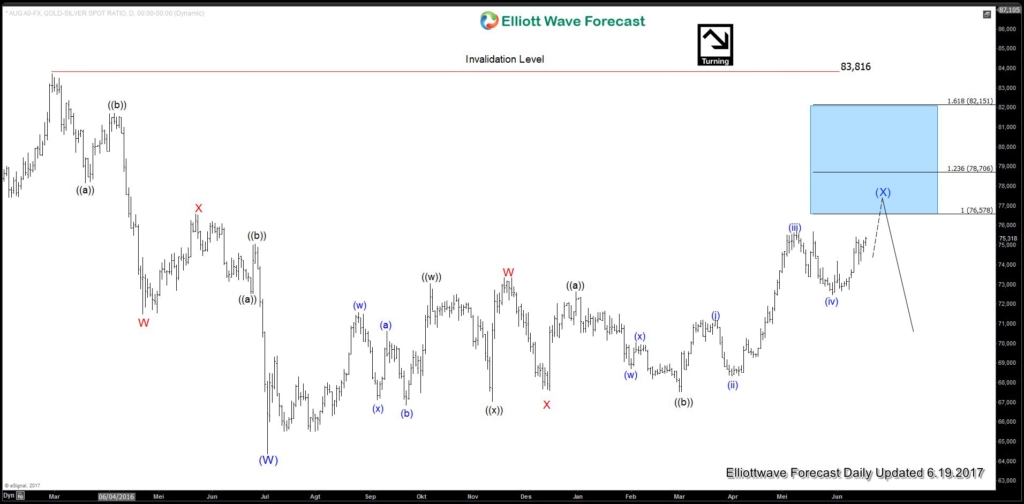
The next graph represents the performance of the platinum-palladium & gold-palladium ratio, a measurement of the number of palladium ounces it takes to buy a single ounce of platinum & gold. Palladium is now almost as expensive as its brother metal platinum for the first time since 2001 as the ratio is near parity and ready to break lower in the near future. The gold-palladium ratio is also catching the move lower and could reach parity if the strong rally in Palladium continues.

Platinum & Gold / Palladium Ratio


Recap
The fundamentals of the palladium market seems to be among the strongest in all the commodities and the recent technical break higher is bringing more bulls to join the rally, so while the metal holds above last year low then it should rise again to make new all time highs above $1100, surpass Platinum and try to catch Gold. The expected move to the upside will support the whole commodity markets so during the short term pullback of palladium, other instrument will either establish new lows or retest the previous one before the entire sector starts rallying again.
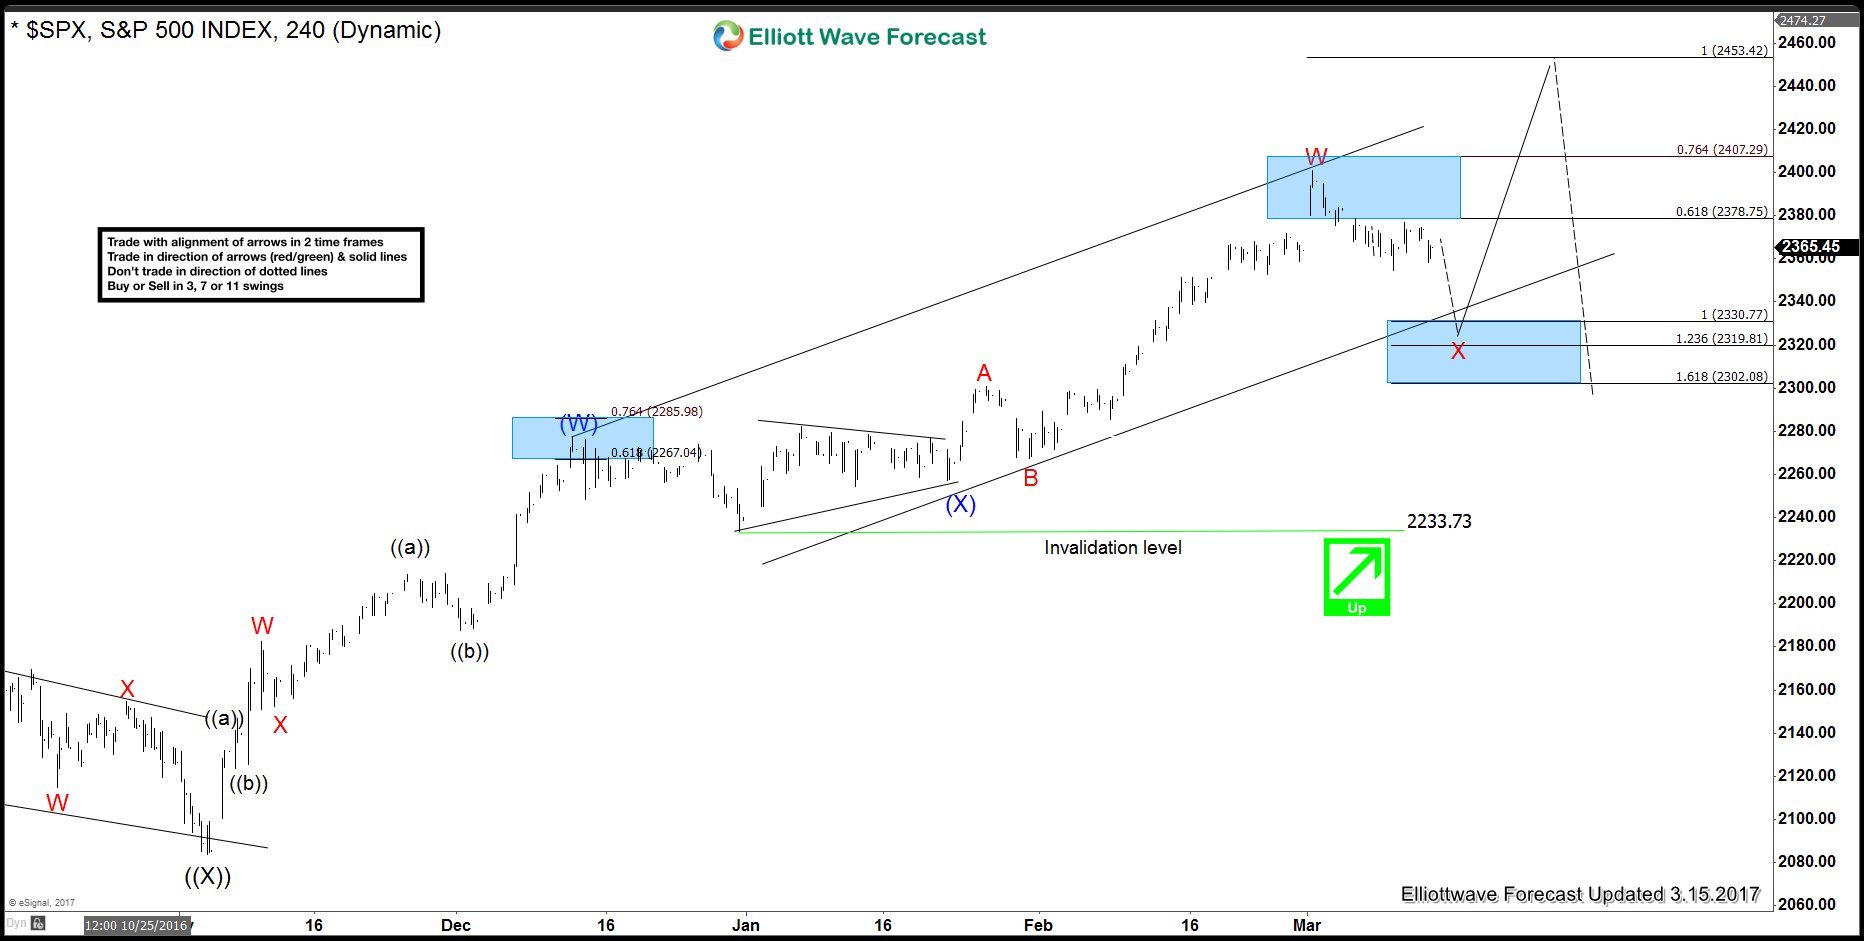
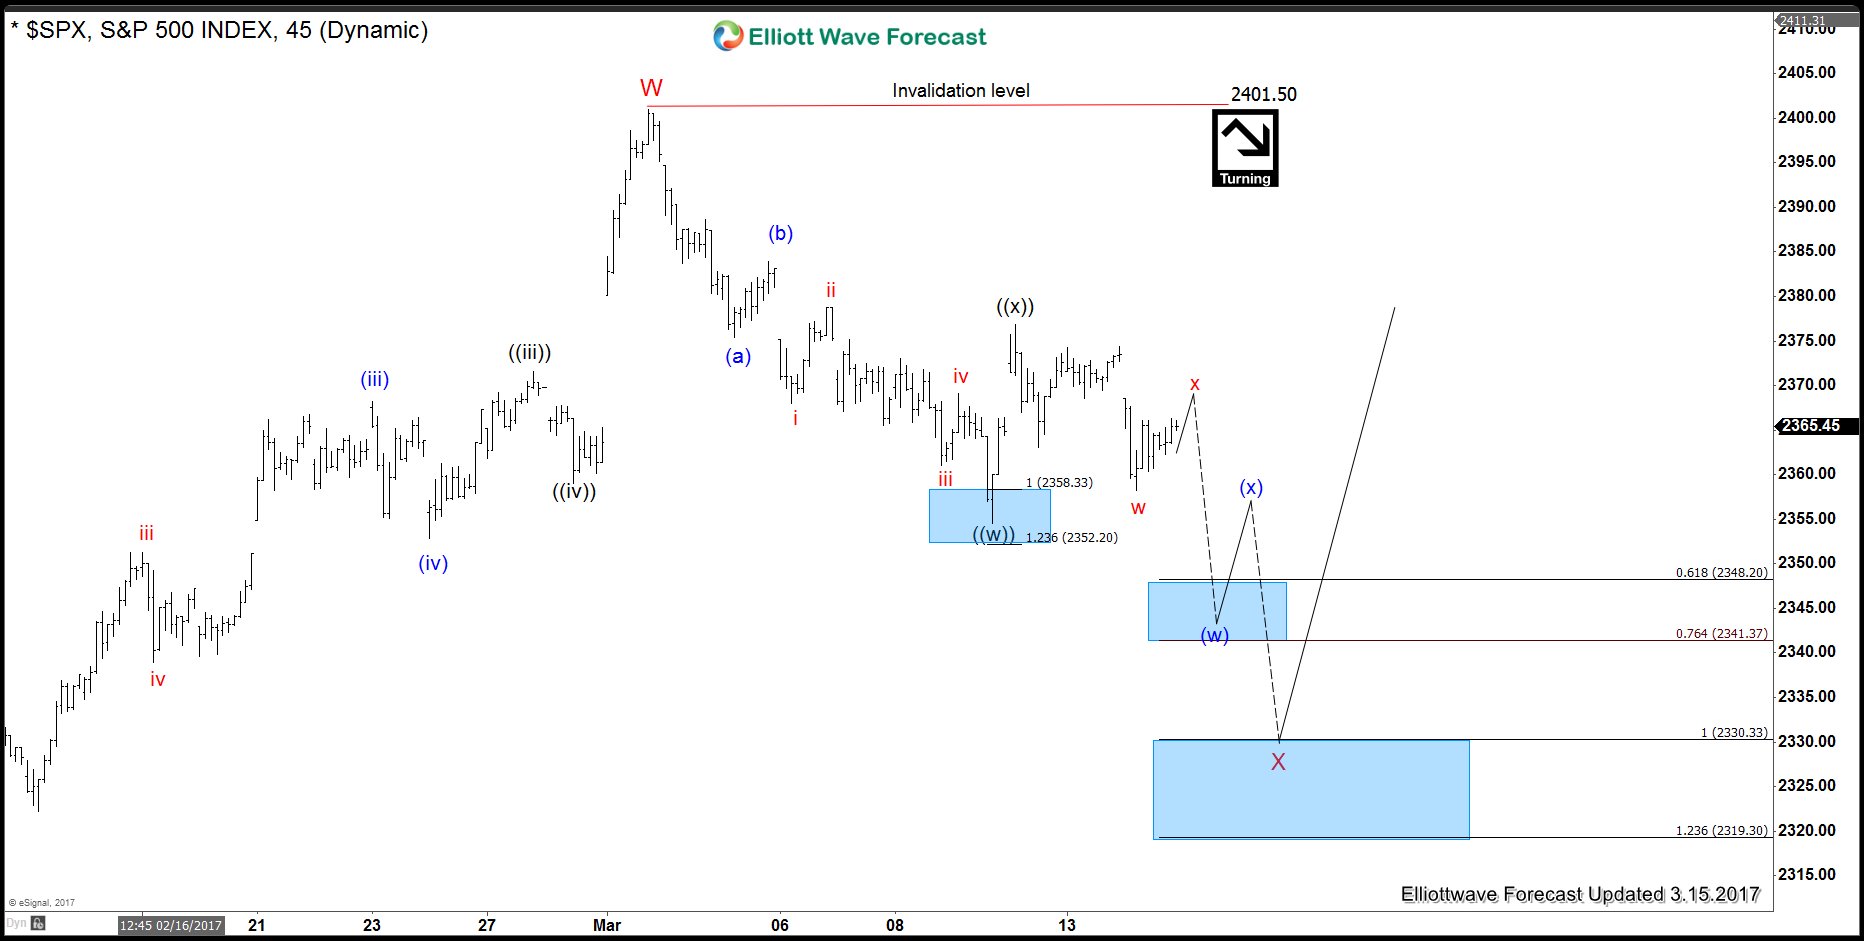
Ayoub Ben Rejeb غير متواجد حالياً  
رد مع اقتباس
عضو نشيط
 
تاريخ التسجيل: Dec 2013
الدولة: Tunisia
المشاركات: 282
خبرة السوق: أكثر من 5 سنوات
معدل تقييم المستوى: 13
Ayoub Ben Rejeb is on a distinguished road
افتراضي رد: Elliott Wave Analysis by EWF
104#
20 - 06 - 2017, 12:12 PM
DAX Elliott Wave Analysis: More Upside

Short term DAX Elliott Wave view suggests the decline to 12491.5 on 5/18 ended Intermediate wave (2). Up from there, the rally is unfolding as a double three Elliott Wave structure. Minute wave ((w)) ended at 12879.5 and Minute wave ((x)) pullback ended at 12616.44. Internal of Minute wave ((x)) is subdivided as an expanded flat Elliott Wave structure where Minutte wave (a) ended at 12633.5 and Minutte wave (b) ended at 12922.5.

A break above Minutte wave ((b)) on 6/14 is necessary to add validity that the next leg higher has started. Up from 12616.44, the rally is unfolding as a zigzag Elliott Wave structure where Minute wave (a) is in progress as 5 waves. Expect a pullback in Minute wave (b) soon to correct cycle from 6/15 low (12616.44). While dips stay above 12616.44, expect Index to extend higher. We do not like selling the proposed pullback and buyers should appear once Minute wave (b) pullback is complete in 3, 7, or 11 swing.

DAX 1 Hour Elliott Wave Chart 06/20/2017


Ayoub Ben Rejeb غير متواجد حالياً  
رد مع اقتباس
عضو فـعّـال
 
تاريخ التسجيل: Oct 2011
المشاركات: 1,356
معدل تقييم المستوى: 16
ميس الفلا is on a distinguished road
افتراضي رد: Elliott Wave Analysis by EWF
105#
20 - 06 - 2017, 03:13 PM
اقتباس:
المشاركة الأصلية كتبت بواسطة Ayoub Ben Rejeb مشاهدة المشاركة
SPX Elliott Wave View: Buying the dips

SPX Index 4 Hour Elliott Wave Analysis 3.15.2017


Elliott Wave sequence analysis of SPX Index from 11/4/2016 low (2083.79) suggests the Index is rallying in a 5 swing bullish sequence and has not reached the 100% – 123.6% target area of 2453 – 2500. The structure of the rally is unfolding as a double three WXY Elliott wave structure or often called a 7 swing structure. Up from 2083.79, Intermediate wave (W) or third swing ended at 2277.53 and Intermediate wave (X) or fourth swing ended at 2257.02. The Index has since broken above 2277.53 and extended higher. SPX is currently in the 61.8 – 76.4 extension area (2378.75 – 2407.29) of the Intermediate wave (W) and wave (X) where fifth swing usually ends. The fifth swing or Minor wave W is proposed complete at 2400.98 within above area and a pullback in Minor wave X or the sixth swing is expected to take place to correct rally from 12/30/2016 low (2233.73).

We believe SPX correction lower is going to take place as RUT (Russell 2000) has already corrected lower and also showing incomplete sequence to the downside. When we look at Russell and other instrument in the market, the overall market correlation suggests SPX should pull back in Minor wave X. Once the pullback is over, then the Index should rally again towards new high at 2453 – 2500 area. We don’t like selling the Index and expect dip buyers to appear once Minor wave X pullback is complete for a new high or at least 3 waves bounce.

SPX Index 1 Hour Elliott Wave Analysis 3.15.2017


The 1 hour Elliott wave view above suggests that while the Index stays below wave ((x)) at 2376.86, it is expected to turn lower within Minute wave () towards 2319.3 – 2330.33 area to end Minor wave X pullback. In the above mentioned area, the Index is expected to find buyers and would have a chance to extend rally in 7th swing to a new high towards 2453 – 2500 area or at least bounce in 3 waves. If Russell does a FLAT from 3/9 low, then SPX could still see 2380 – 2385 area to complete wave ((x)) as a FLAT before making the next push lower to complete wave X pull back. We do not like selling the proposed pullback as the Elliott wave sequence in the higher degree from 11/4/2016 low remains bullish and prefer to use the dips as a buying opportunity at extreme areas.
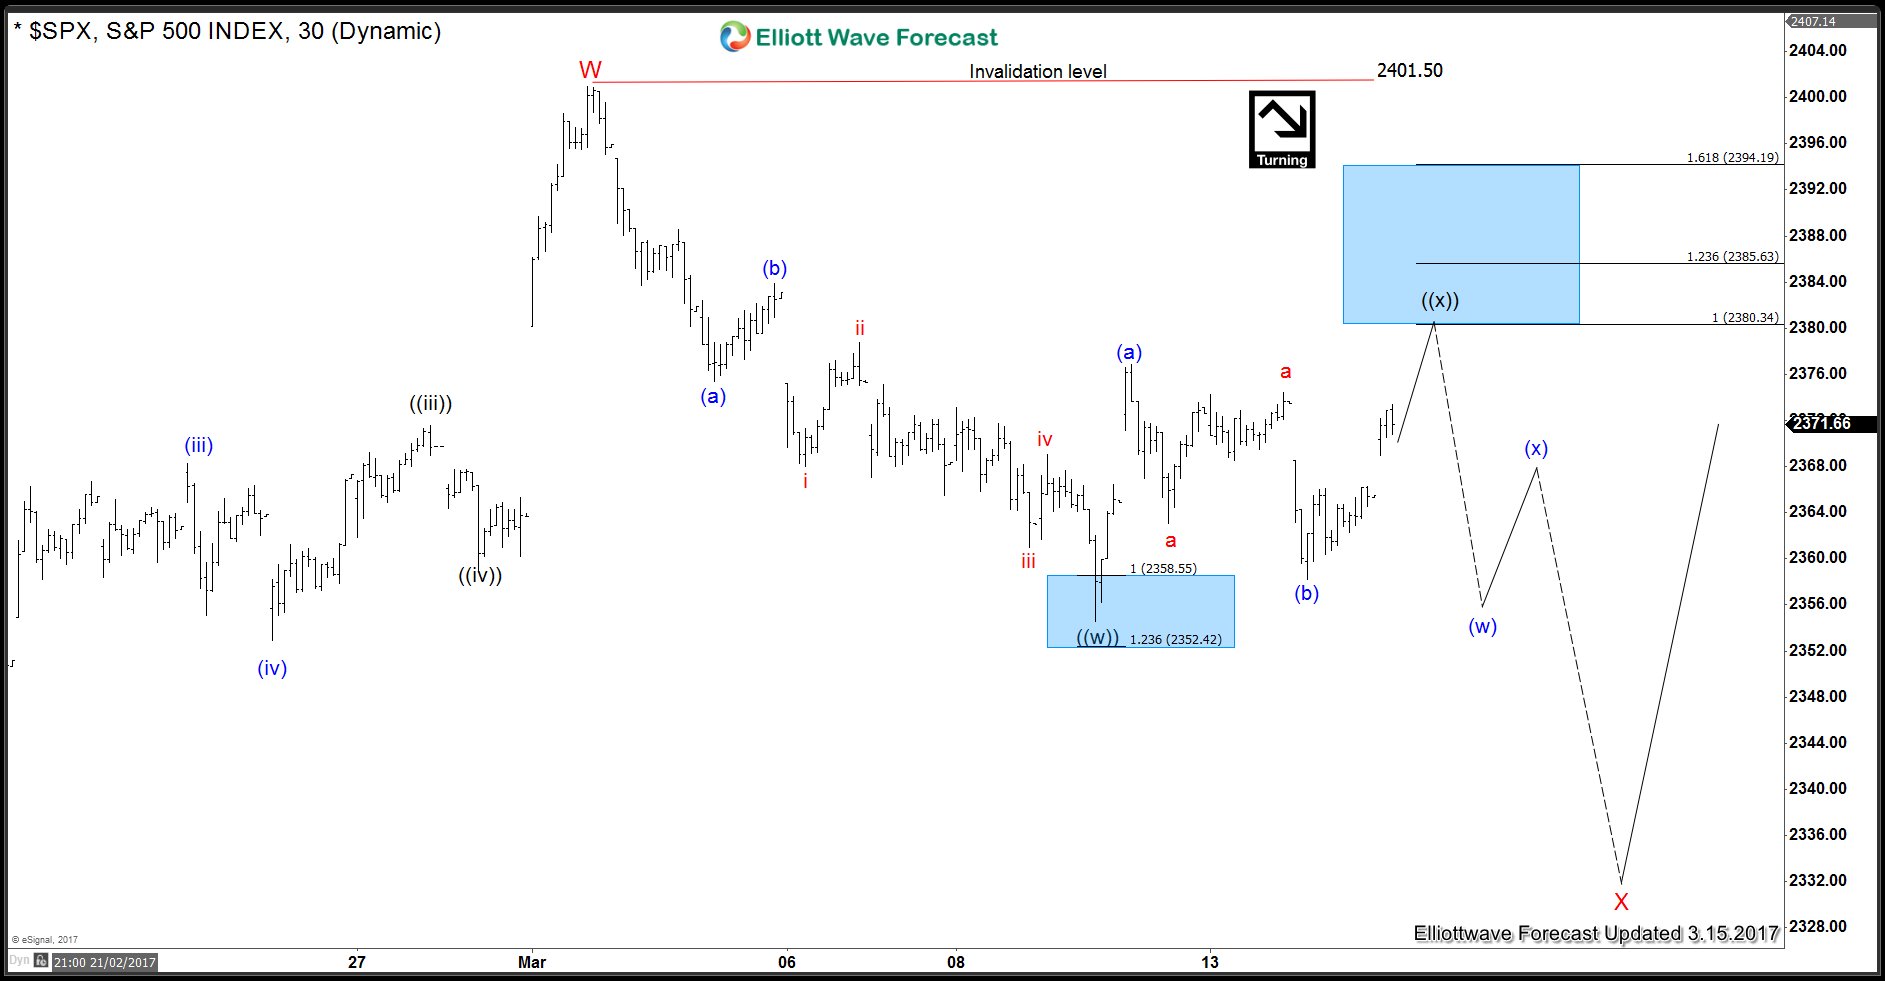
SPX Index 1 Hour Elliott Wave chart with FLAT ((x))
بعد ما انكتب الموضوع بالعنكليزي .... صار بدو صبر أيوب
Ayoub Ben Rejeb likes this.
ميس الفلا غير متواجد حالياً  
رد مع اقتباس
عضو فـعّـال
 
تاريخ التسجيل: Oct 2011
المشاركات: 1,356
معدل تقييم المستوى: 16
ميس الفلا is on a distinguished road
افتراضي رد: Elliott Wave Analysis by EWF
106#
20 - 06 - 2017, 03:18 PM
اقتباس:
المشاركة الأصلية كتبت بواسطة ميس الفلا مشاهدة المشاركة
بعد ما انكتب الموضوع بالعنكليزي .... صار بدو صبر أيوب
أيوب .... عم تشتغل لحالك ... ما في مشاركة تذكر .... رجاءاً إتعب على حالك شوي ... واكتب بالعربي .... وأذكر حضرتك لعلك لا تعلم ..... منتدى بورصات .... عربي إبن عربي
أتمنى أن تكون المشاركات والفعاليات من الجمهور أكثر ... ولكن ما باليد حيلة
ميس الفلا غير متواجد حالياً  
رد مع اقتباس
عضو فـضـي
 
تاريخ التسجيل: Jul 2010
المشاركات: 3,680
معدل تقييم المستوى: 19
THE-ZERO is on a distinguished road
افتراضي رد: Elliott Wave Analysis by EWF
107#
20 - 06 - 2017, 03:21 PM
يا إخوان الرجل مجتهد والتحليلات ليس هو من يكتبها .. هو ينقلها لكم للفائدة وليس ملزم بالترجمة ..
Ayoub Ben Rejeb likes this.
THE-ZERO غير متواجد حالياً  
رد مع اقتباس
عضو نشيط
 
تاريخ التسجيل: Dec 2013
الدولة: Tunisia
المشاركات: 282
خبرة السوق: أكثر من 5 سنوات
معدل تقييم المستوى: 13
Ayoub Ben Rejeb is on a distinguished road
افتراضي رد: Elliott Wave Analysis by EWF
108#
20 - 06 - 2017, 05:18 PM
اقتباس:
المشاركة الأصلية كتبت بواسطة ميس الفلا مشاهدة المشاركة
أيوب .... عم تشتغل لحالك ... ما في مشاركة تذكر .... رجاءاً إتعب على حالك شوي ... واكتب بالعربي .... وأذكر حضرتك لعلك لا تعلم ..... منتدى بورصات .... عربي إبن عربي
أتمنى أن تكون المشاركات والفعاليات من الجمهور أكثر ... ولكن ما باليد حيلة
كل مافعله هو نقل التحليلات كما هي
Ayoub Ben Rejeb غير متواجد حالياً  
رد مع اقتباس
عضو نشيط
 
تاريخ التسجيل: Dec 2013
الدولة: Tunisia
المشاركات: 282
خبرة السوق: أكثر من 5 سنوات
معدل تقييم المستوى: 13
Ayoub Ben Rejeb is on a distinguished road
افتراضي رد: Elliott Wave Analysis by EWF
109#
20 - 06 - 2017, 05:20 PM
Gold-to-Silver Ratio Near Turning

Gold-to-Silver Ratio Daily Chart


Gold-to-Silver ratio is correcting cycle from 2/29/2016 peak (83.68) in 7 swing. While the bounces fail below 83.68 high, the ratio should resume lower or at least pullback in 3 waves. Down from 2/29/2016 peak, Intermediate wave (W) ended at 64.38. Intermediate wave (X) is in progress to correct cycle from 2/29/2016 towards 76.58 – 78.7 area before the Ratio turns lower. Short term, while the Ratio stays above 72.46, it should continue higher towards the target above before 3 waves pullback at least.

With the Ratio hovering near the high end of the range, the next leg in the instrument is likely lower after the bounce ends. The Ratio is inversely correlated with the underlying physical metals. This means when the Ratio hits the target and turns lower, Gold and Silver should be supported. Thus, as the Ratio reaches the target of 76.55 – 78.68 and turns lower, both metals can start rallying also.
Ayoub Ben Rejeb غير متواجد حالياً  
رد مع اقتباس
عضو جديد
 
تاريخ التسجيل: Nov 2014
المشاركات: 32
معدل تقييم المستوى: 0
kmalexfx is on a distinguished road
افتراضي رد: Elliott Wave Analysis by EWF
110#
20 - 06 - 2017, 05:25 PM
اقتباس:
المشاركة الأصلية كتبت بواسطة Ayoub Ben Rejeb مشاهدة المشاركة
كل مافعله هو نقل التحليلات كما هي
بارك الله فيك متابعينك ومعلش استحمل شويه التعليقات الغريبة دي
Ayoub Ben Rejeb likes this.
kmalexfx غير متواجد حالياً  
رد مع اقتباس


إضافة رد

الكلمات الدلالية (Tags)
commodity, elliott wave, forex, stocks


جديد مواضيع منتدى تداول العملات العام

المواضيع المتشابهه
الموضوع كاتب الموضوع المنتدى مشاركات آخر مشاركة
elliott wave Nnana123 منتدى تداول العملات العام 6 11 - 04 - 2015 07:07 PM


11:18 AM