• 8:36 صباحاً


Elliott Wave Analysis by EWF

إضافة رد
Like Tree17Likes

أدوات الموضوع
عضو نشيط
 
تاريخ التسجيل: Dec 2013
الدولة: Tunisia
المشاركات: 282
خبرة السوق: أكثر من 5 سنوات
معدل تقييم المستوى: 13
Ayoub Ben Rejeb is on a distinguished road
افتراضي رد: Elliott Wave Analysis by EWF
141#
20 - 07 - 2017, 12:41 PM
DXY Elliott Wave View: Bounce in progress

Short term DXY (USD Index) Elliott Wave view suggests the decline from 6/20 peak (97.87) is unfolding as a Zigzag Elliott Wave structure. Down from 97.87 high, decline to 95.47 ended Minor wave A, and bounce to 96.51 high ended Minor wave B. Wave C is unfolding as an Elliott wave Impulse structure with extension where Minute wave ((i)) ended at 95.75, Minute wave ((ii)) ended at 96.2, and Minute wave ((iii)) ended at 94.47. Minute wave ((iii)) is subdivided into another impulsive wave of a smaller degree. Minutte wave (i) ended at 95.51, Minutte wave (ii) ended at 95.98, Minutte wave (iii) ended at 95.01, Minutte wave (iv) ended at 95.24, and Minutte wave (v) of ((iii)) ended at 94.47.

Currently Minutte wave ((iv)) is in progress to correct cycle from 7/10 high as a double three Elliott wave structure towards 95.05 – 95.15. While pivot at 7/10 high holds, expect Index to turn lower again. We don’t like buying the Index and expect bounces to find offer in the above area for more downside or 3 waves pullback at least.

DXY 1 Hour Elliott Wave Chart
Ayoub Ben Rejeb غير متواجد حالياً  
رد مع اقتباس

عضو نشيط
 
تاريخ التسجيل: Dec 2013
الدولة: Tunisia
المشاركات: 282
خبرة السوق: أكثر من 5 سنوات
معدل تقييم المستوى: 13
Ayoub Ben Rejeb is on a distinguished road
افتراضي رد: Elliott Wave Analysis by EWF
142#
20 - 07 - 2017, 02:10 PM
JPM Elliott Wave Bullish Structure

The Elliott Wave view for JPMorgan Chase (NYSE: JPM) suggests the rally from February 2016 low (52.5) to 03/01/2017 peak (93.98) have ended wave (3). The pullback from there unfolded as zigzag ABC structure which ended wave (4) at 06/01/2017 low (81.79). Up from there, the stock rallied in another zigzag structure before ending that short term cycle after reaching extreme on 07/06/2017 peak (94.51).

Therefore, JPM made new all time highs and it’s now showing 5 waves from 2016 low and still looking to reach the minimum target at $100.5. The stock can either rally from current levels as it already did 3 waves pullback and reached short term equal legs area 90.9 – 89.39, or the correction can still extend further toward the 50 – 76.4 Fibonacci retracement before finding buyers again to rally to new highs or bounce in 3 waves at least.

However if JPM fails to make new highs and the pivot at June low gives up, then the stock could be still in wave (4) doing an Irregular Flat correction which can take it toward 82-97 area before being able to resume the rally.

JPM 4H Chart 07/20/2017


The market conditions have changed over time, so instruments can now be trending higher or lower in series of 3 wave sequences rather than impulsive sequence and this can be frequently seen in the forex market. No one is perfect and we don’t claim to have 100% accuracy, but a system with high accuracy acts as a great trading tool because forecasting is a process of continuous adjustments. A waver (trader) needs to accept when an idea doesn’t work out and adjust to new data.
Ayoub Ben Rejeb غير متواجد حالياً  
رد مع اقتباس
عضو نشيط
 
تاريخ التسجيل: Dec 2013
الدولة: Tunisia
المشاركات: 282
خبرة السوق: أكثر من 5 سنوات
معدل تقييم المستوى: 13
Ayoub Ben Rejeb is on a distinguished road
افتراضي رد: Elliott Wave Analysis by EWF
143#
21 - 07 - 2017, 06:06 PM
DXY Elliott Wave View: Resuming Downside

Revised short term DXY (USD Index) Elliott Wave view suggests the decline from 6/20 peak (97.87) is unfolding as a double three Elliott wave structure. Down from 97.87 high, decline to 95.47 ended Minor wave W, and bounce to 96.51 high ended Minor wave X. Wave Y is unfolding as another double three Elliott wave structure of a smaller degree where Minute wave ((w)) ended at 94.47 and Minute wave ((x)) ended at 95.17. The Index has broken below 94.47 suggesting Minute wave ((y)) lower has started. Down from 94.47, Minutte wave (w) ended at 94.09, and Minutte wave (x) is in progress to correct cycle from 7/20 peak before Index resumes lower. We don’t like buying the proposed bounce and expect sellers to appear after Minutte wave (x) bounce is complete in 3, 7, or 11 swing as far as pivot at 95.17 stays intact.

DXY 1 Hour Elliott Wave Chart
Ayoub Ben Rejeb غير متواجد حالياً  
رد مع اقتباس
عضو نشيط
 
تاريخ التسجيل: Dec 2013
الدولة: Tunisia
المشاركات: 282
خبرة السوق: أكثر من 5 سنوات
معدل تقييم المستوى: 13
Ayoub Ben Rejeb is on a distinguished road
افتراضي رد: Elliott Wave Analysis by EWF
144#
01 - 08 - 2017, 12:30 PM
DAX Elliott Wave View: More Downside

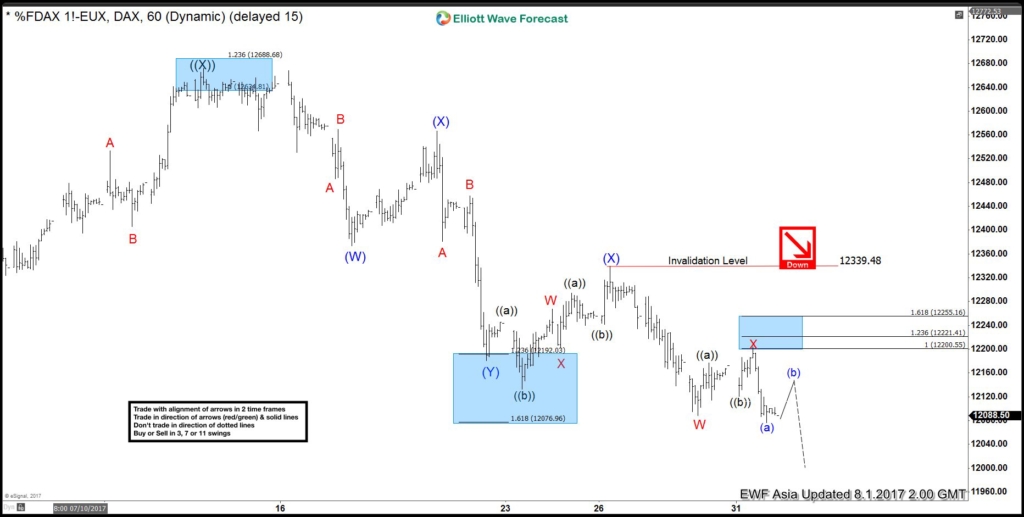
Short term DAX Elliott Wave view suggests the decline from 5/15 high is unfolding as a double three Elliott wave structure. Down from 5/15 peak, Primary wave ((W)) ended at 12303 as a Flat and Primary wave ((X)) bounce ended at 12672. Primary wave ((Y)) is currently in progress and unfolding as a triple three Elliott wave structure. Down from 12672 peak, Intermediate wave (W) ended at 12373.5, Intermediate wave (X) ended at 12567, Intermediate wave (Y) ended at 12180.5 and Intermediate second wave (X) ended at 12339.48. Near term, while bounces stay below 12339.48, expect the Index to resume lower towards 11878.65 – 12030.11 area to end cycle from 5/15 high. Afterwards, from that area, expect the Index to at least bounce in 3 waves to correct cycle from 5/15 high.

DAX 1 Hour Elliott Wave Chart

Ayoub Ben Rejeb غير متواجد حالياً  
رد مع اقتباس
عضو نشيط
 
تاريخ التسجيل: Dec 2013
الدولة: Tunisia
المشاركات: 282
خبرة السوق: أكثر من 5 سنوات
معدل تقييم المستوى: 13
Ayoub Ben Rejeb is on a distinguished road
افتراضي رد: Elliott Wave Analysis by EWF
145#
01 - 08 - 2017, 01:02 PM
NASDAQ Composite Index should pullback soon

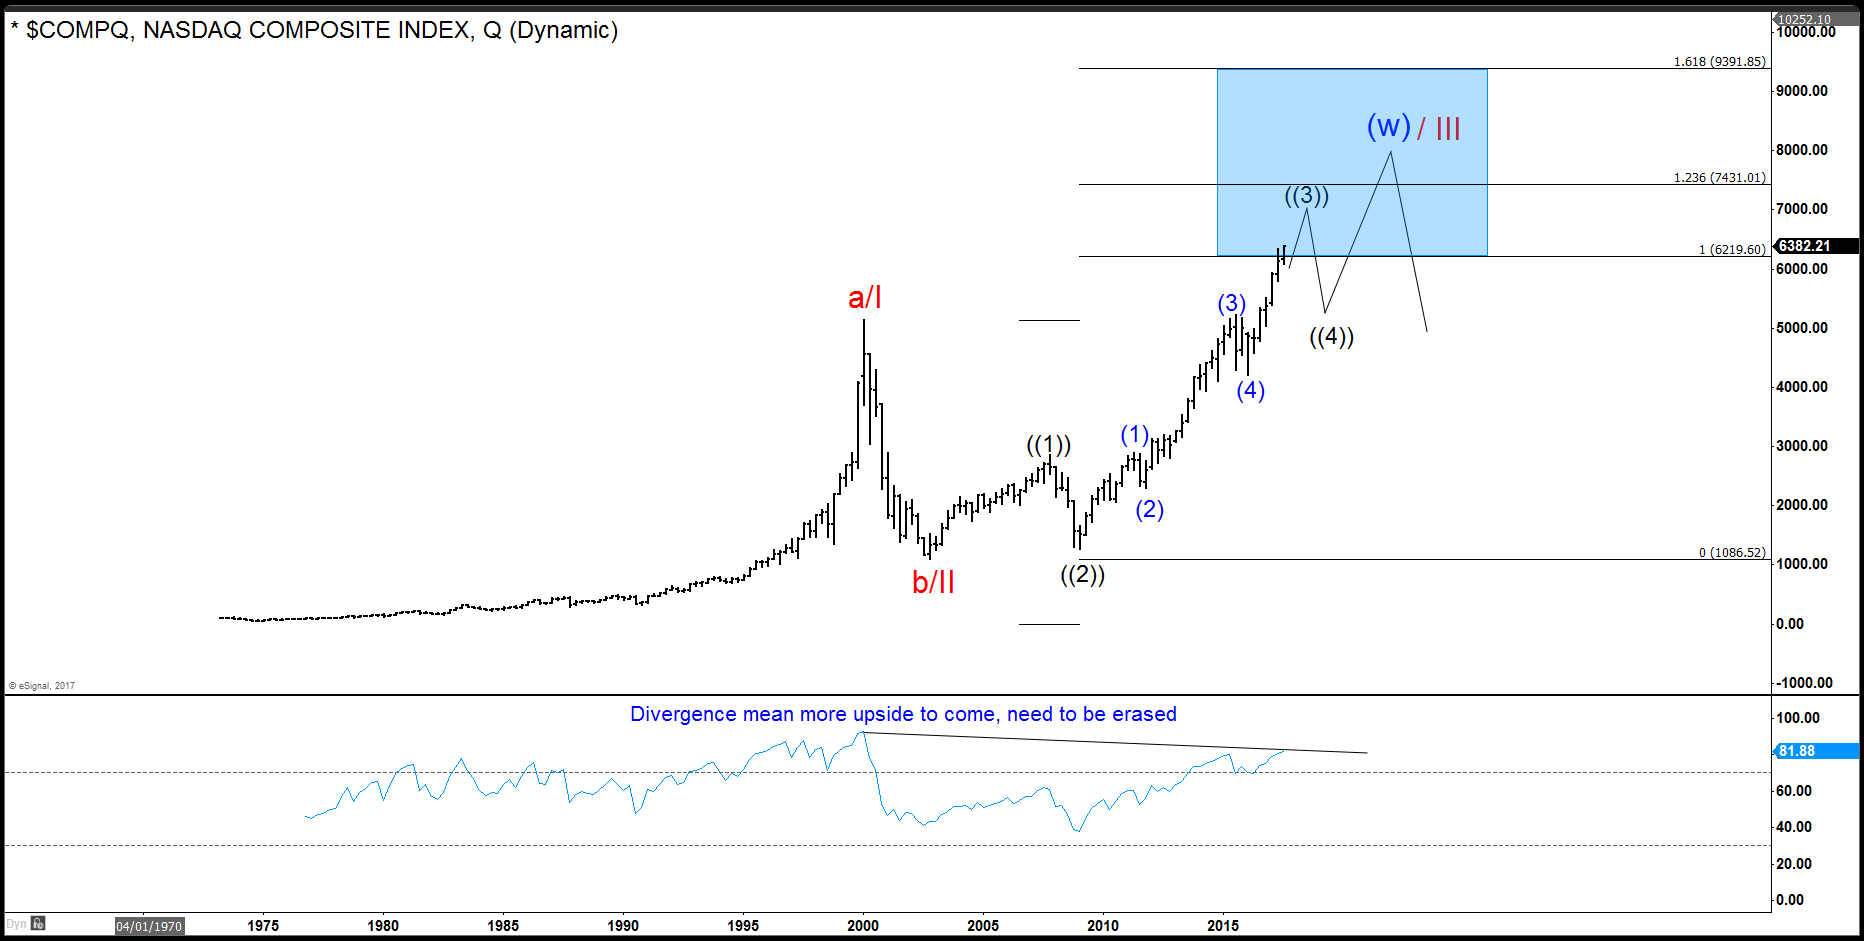
The following chart shows NASDAQ composite index. The index has a tremendous rally since the lows around 1975 which is pretty close to the zero level. The index has reached the bottom of the blue box at 6219 area. The question then is whether the index will extend higher or start correcting lower as the minimal target has been reached. As we often say, Elliott wave theory by itself is not enough. In this case, we can see that from the zero line, we can count the index as a completed ABC. However, we can also count it as an incomplete ABC with a black((4)) still to happen. In the Elliott wave theory, any five waves structure always at one moment is a three wave move. It is therefore too early at this stage to determine if the rally will develop into a five waves move.

In Elliottwave-forecast, we have implemented new ideas and tools to make the theory a more reliable tool. We use cycles, sequences, distributions and momentum indicators to increase the accuracy of Elliott wave theory. As we show in the chart, the RSI (Relative Strength Index) indicator is still showing a divergence compared to the peak in 1999. One of the rules that we introduced in the new Eliott wave theory is that a three waves move can not have divergence in any single time frame. Looking at Nasdaq quarterly chart, we can observe the divergence between momentum and price action. Thus, the index still has scope to extend into the areas of 7431 minimal or even reach the 9391 area before the 2009 rally is complete.

The five waves move in blue degree is now about to end. But we feel very comfortable to say that the pullback will be another buying opportunity. It is very easy to trade following our forecast. We always prioritize the trend and we use a distribution system and a series of pivots and cycles to prioritize the trend. In conclusion, even though the index has reached the minimal target, a multi market correlation and simple indicator like the RSI are calling for a pullback soon into a wave four but more upside to follow afterwards.

Long Term Nasdaq Elliott Wave Path

Ayoub Ben Rejeb غير متواجد حالياً  
رد مع اقتباس
عضو نشيط
 
تاريخ التسجيل: Dec 2013
الدولة: Tunisia
المشاركات: 282
خبرة السوق: أكثر من 5 سنوات
معدل تقييم المستوى: 13
Ayoub Ben Rejeb is on a distinguished road
افتراضي رد: Elliott Wave Analysis by EWF
146#
01 - 08 - 2017, 01:25 PM
SPX500 Bullish Elliott Wave Sequence

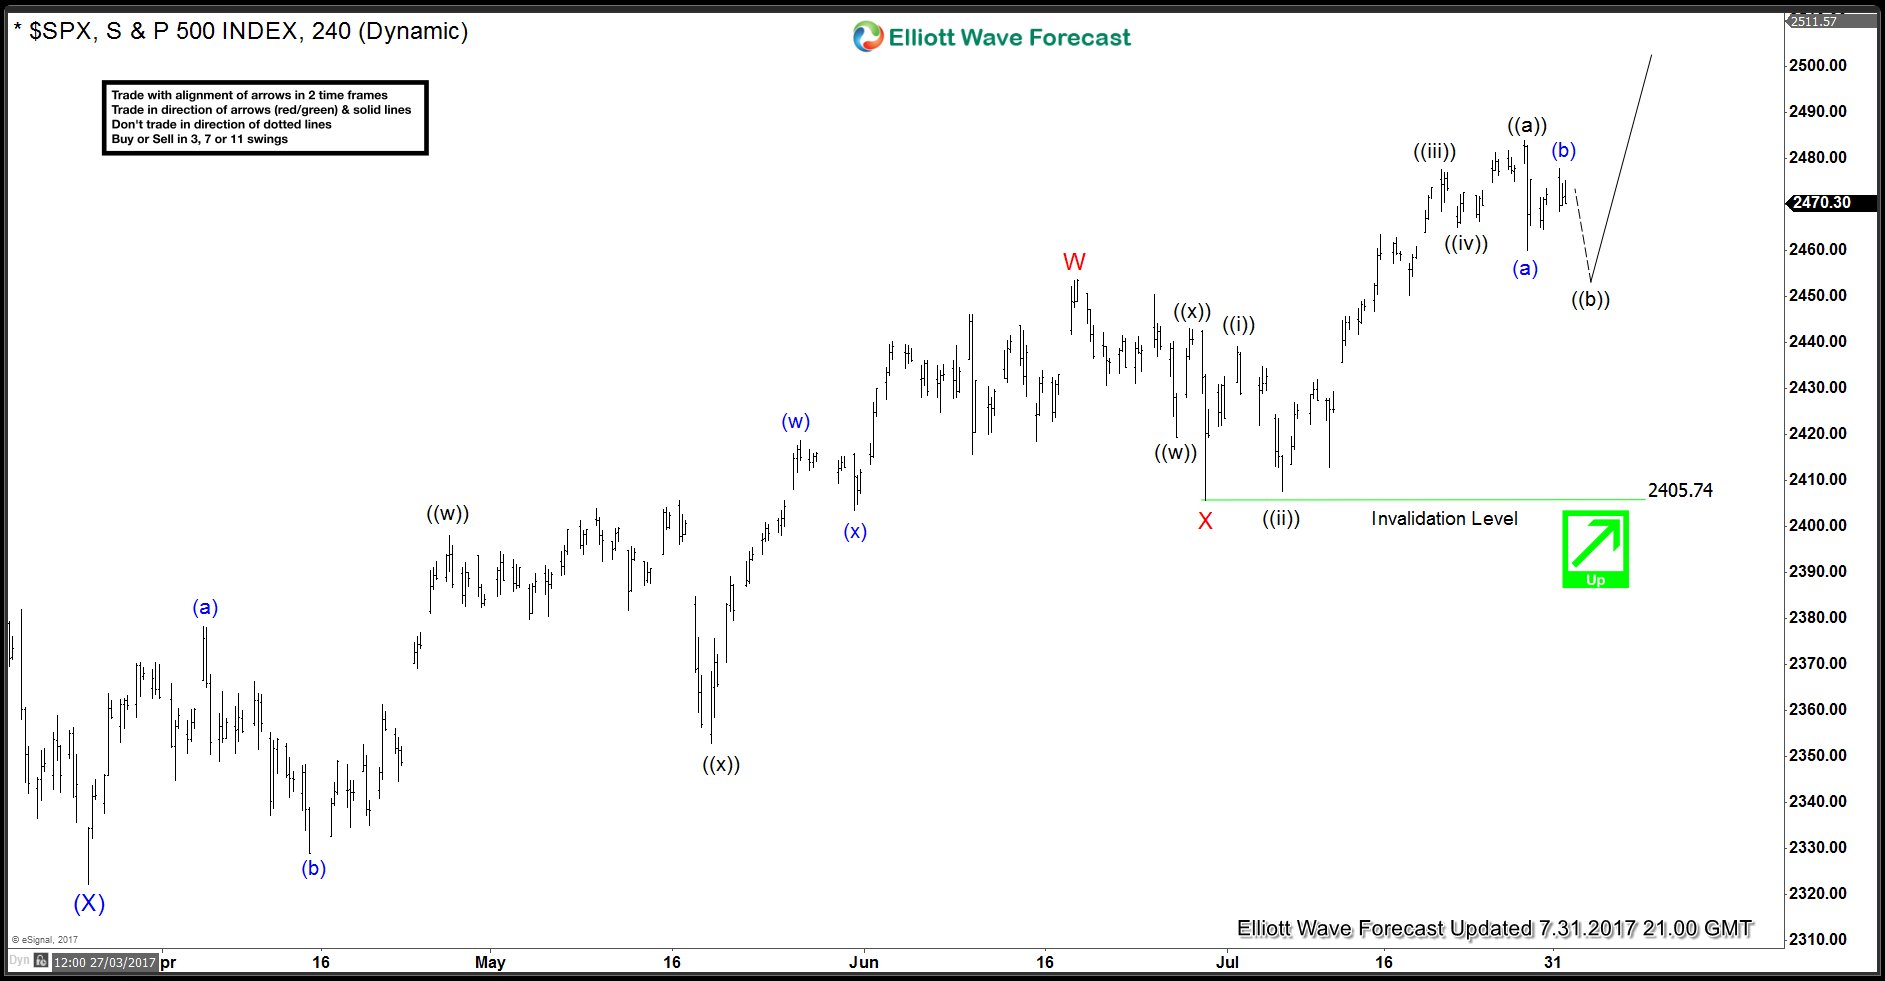
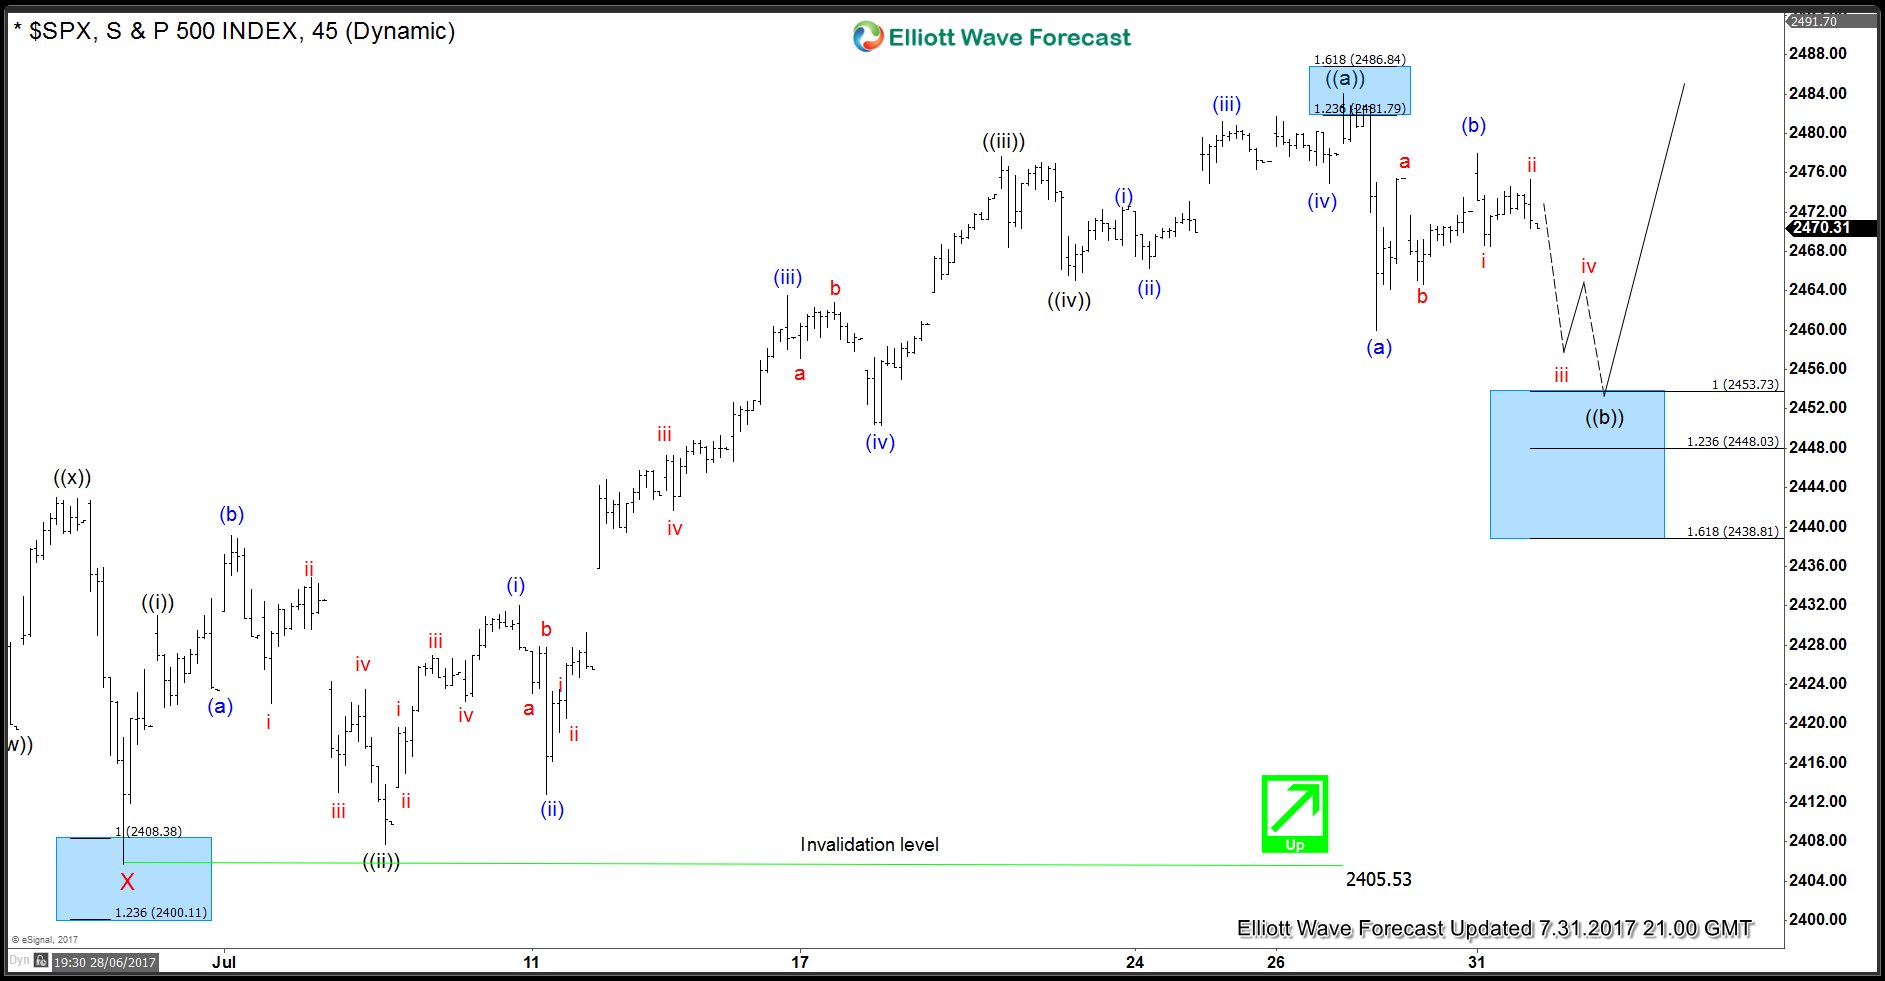
SPX500 move up from 3/27 (2322) low is proposed to be unfolding as a double three Elliott wave structure when rally to 6/19 (2453) completed wave W and dip to 6/29 (2405.74) completed wave X. Up from there, Index rallied in 5 waves to 7/27 (2484) which completed wave ((a)) of Y and now the Index is showing 5 swings up from 3/27 low. 5 swings is an incomplete sequence and calls for more upside to complete 7 swings sequence. Index is currently in wave ((b)) correcting the cycle from 2405.74 low. This pull back is expected to unfold as a zig-zag Elliott wave pattern and while below 7/31 (2477), SPX500 has scope to trade lower towards 2453.73 – 2438.81 area to complete wave ((b)). From this area, SPX500 should turn higher to resume the rally in wave ((c)) of Y towards 2537 – 2568 area or bounce in three waves at least. In case the bounce from the above mentioned area fails to make a new high, then Index could turn lower and do a 7 swings pull back in wave ((b)) before starting wave ((c)) higher. We don’t like selling the Index and favor buying the dip towards 2453.73 – 2438.81 area looking for a target of 2537 area or a 3 waves bounce at least to get into a risk free position.

SPX500 4 Hour Elliott Wave Chart


SPX500 Potential buying area

Ayoub Ben Rejeb غير متواجد حالياً  
رد مع اقتباس
عضو نشيط
 
تاريخ التسجيل: Dec 2013
الدولة: Tunisia
المشاركات: 282
خبرة السوق: أكثر من 5 سنوات
معدل تقييم المستوى: 13
Ayoub Ben Rejeb is on a distinguished road
افتراضي رد: Elliott Wave Analysis by EWF
147#
02 - 08 - 2017, 01:02 PM
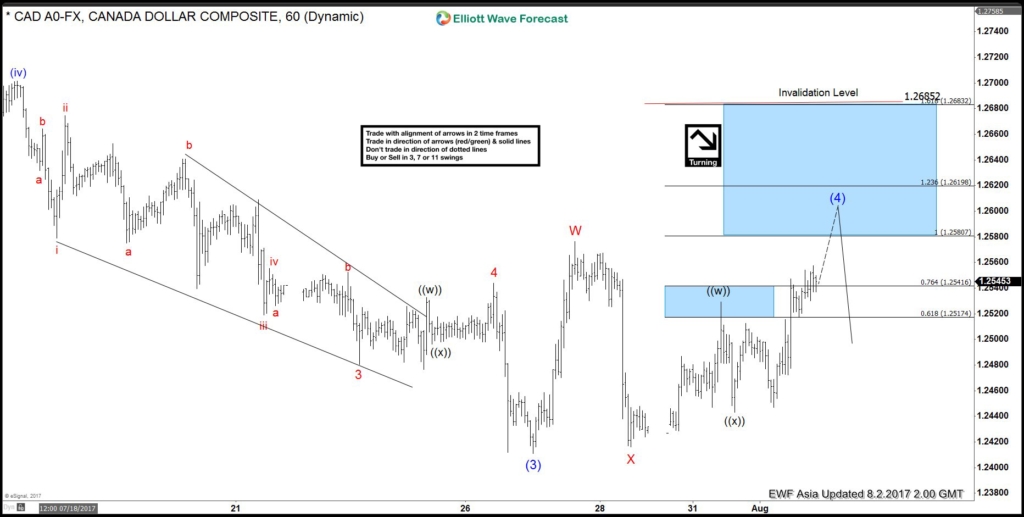
USDCAD Elliott Wave View: Wave (4) in progress

Short term USDCAD Elliott Wave view suggests the decline to 1.2411 ended Intermediate wave (3) of an Elliott Wave impulse structure from 6/2 peak. Intermediate wave (4) bounce is in progress as a double three Elliott wave structure where Minor wave W ended at 1.2576 and Minor wave X ended at 1.2416. Minor wave Y is subdivided also as a double three Elliott Wave structure. Up from 1.2416 low, Minute wave ((w)) ended at 1.253 and Minute wave ((x)) ended at 1.2443. Near term focus is on 1.258 – 1.262 area to complete Intermediate wave (4). Afterwards, pair should either resume to new low or at least pullback in 3 waves. We don’t like buying the proposed bounce.

USDCAD 1 Hour Elliott Wave Chart

Ayoub Ben Rejeb غير متواجد حالياً  
رد مع اقتباس
عضو نشيط
 
تاريخ التسجيل: Dec 2013
الدولة: Tunisia
المشاركات: 282
خبرة السوق: أكثر من 5 سنوات
معدل تقييم المستوى: 13
Ayoub Ben Rejeb is on a distinguished road
افتراضي رد: Elliott Wave Analysis by EWF
148#
03 - 08 - 2017, 01:37 PM
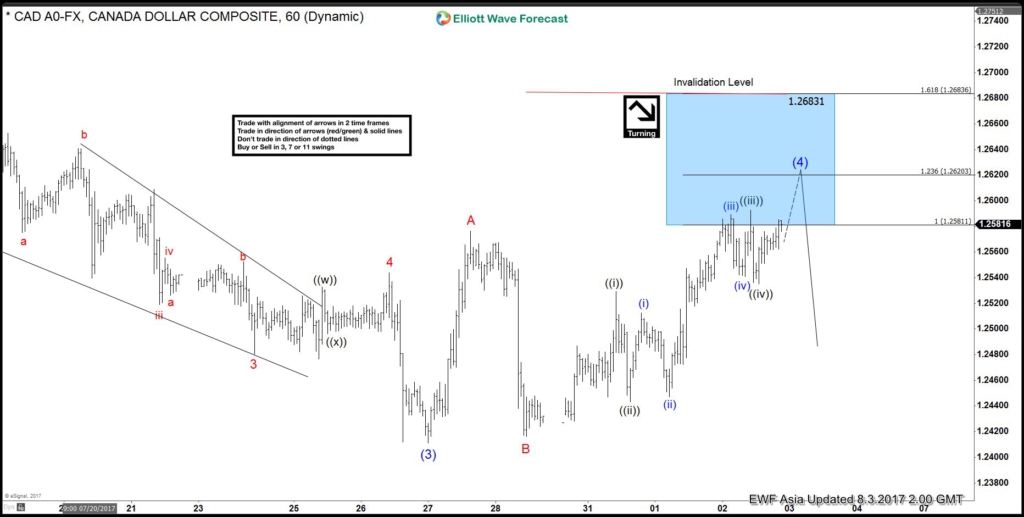
USDCAD Elliott Wave View: Flat correction

Short term USDCAD Elliott Wave view suggests the decline to 1.2411 ended Intermediate wave (3) of an Elliott Wave impulse structure from 6/2 peak. Intermediate wave (4) bounce is in progress as a flat Elliott wave structure where Minor wave A ended at 1.2576 and Minor wave B ended at 1.2416. Minor wave C is subdivided as an impulse Elliott Wave structure. Up from 1.2416 low, Minute wave ((i)) ended at 1.253, Minute wave ((ii)) ended at 1.2443, Minute wave ((iii)) ended at 1.2593 and Minute wave ((iv)) ended at 1.2355. Near term focus is on 1.262 – 1.2683 to complete Intermediate wave (4) flat. Afterwards, pair should either resume to new low or at least pullback in 3 waves. We don’t like buying the proposed bounce.

USDCAD 1 Hour Elliott Wave Chart


Ayoub Ben Rejeb غير متواجد حالياً  
رد مع اقتباس
عضو نشيط
 
تاريخ التسجيل: Dec 2013
الدولة: Tunisia
المشاركات: 282
خبرة السوق: أكثر من 5 سنوات
معدل تقييم المستوى: 13
Ayoub Ben Rejeb is on a distinguished road
افتراضي رد: Elliott Wave Analysis by EWF
149#
03 - 08 - 2017, 01:48 PM
EURCAD Selling Opportunity

On June 13/2017 I published an article EURCAD : Sell the Bounce Bearish Pattern where I called for the pair to make another move lower after a bounce/retracement higher. EURCAD since then bounced and continued lower as expected but did not fully close the April 13/2017 market gap as I would have liked it to do. With still a market gap yet to be closed we at ElliottWave-Forecast believe EURCAD will make another push lower and the chart below explains where bears will be waiting to push the pair lower.

EURCAD 4 Hour Chart Bearish Pattern: Traders need to wait for price to hit the BC 0.50% (1.4865) where blue point D can possibly terminate and trigger sells. As long as price stays below the point B high (1.5255) expect EURCAD to continue lower. The area to watch for possible reversal lower is 1.4865 – 1.4920


If looking to sell EURCAD traders should be patient and wait for price to make a move higher towards the BC 0.50% Fib. retracement level at 1.4866. Waiting for price to hit the BC 0.50% Fib. retracement minimum will offer a better risk/reward trade setup. Blue bullish pattern is invalidated if price moves above point B of the pattern.

Of course, like any strategy/technique, there will be times when the strategy/technique fails so proper money/risk management should always be used on every trade.

*** Always use proper risk/money management according to your account size ***
Ayoub Ben Rejeb غير متواجد حالياً  
رد مع اقتباس
عضو نشيط
 
تاريخ التسجيل: Dec 2013
الدولة: Tunisia
المشاركات: 282
خبرة السوق: أكثر من 5 سنوات
معدل تقييم المستوى: 13
Ayoub Ben Rejeb is on a distinguished road
افتراضي رد: Elliott Wave Analysis by EWF
150#
04 - 08 - 2017, 11:37 AM
USDCAD Elliott Wave View: Correction Ended

Short term USDCAD Elliott Wave view suggests the decline to 1.2411 ended Intermediate wave (3) of an Elliott Wave impulse structure from 6/2 peak. Intermediate wave (4) bounce is in progress as a flat Elliott wave structure where Minor wave A ended at 1.2576 and Minor wave B ended at 1.2416. Minor wave C is subdivided as an impulse Elliott Wave structure. Up from 1.2416 low, Minute wave ((i)) ended at 1.253 and pullback to 1.2443 ended Minute wave ((ii)). Pair then rallied in Minute wave ((iii)) ending at 1.2593 and Minute wave ((iv)) pullback ended at 1.2355. Near term, Minute wave ((v)) of C is proposed complete at 1.2619, which also complete Intermediate wave (4). While bounces stay below 1.2619, and more importantly below 1.2683, expect pair to extend lower or at least pullback in 3 waves. We don’t like buying the pair.

USDCAD 1 Hour Elliott Wave Chart

Ayoub Ben Rejeb غير متواجد حالياً  
رد مع اقتباس


إضافة رد

الكلمات الدلالية (Tags)
commodity, elliott wave, forex, stocks


جديد مواضيع منتدى تداول العملات العام

المواضيع المتشابهه
الموضوع كاتب الموضوع المنتدى مشاركات آخر مشاركة
elliott wave Nnana123 منتدى تداول العملات العام 6 11 - 04 - 2015 07:07 PM


08:36 AM