• 11:30 صباحاً


Elliott Wave Analysis by EWF

إضافة رد
Like Tree17Likes

أدوات الموضوع
عضو جديد
 
تاريخ التسجيل: Aug 2009
المشاركات: 230
معدل تقييم المستوى: 17
محمدي. is on a distinguished road
افتراضي رد: Elliott Wave Analysis by EWF
171#
01 - 09 - 2017, 10:20 PM
الاسترالي دولار لوسمحت
محمدي. غير متواجد حالياً  
رد مع اقتباس

عضو نشيط
 
تاريخ التسجيل: Dec 2013
الدولة: Tunisia
المشاركات: 282
خبرة السوق: أكثر من 5 سنوات
معدل تقييم المستوى: 13
Ayoub Ben Rejeb is on a distinguished road
افتراضي رد: Elliott Wave Analysis by EWF
172#
06 - 09 - 2017, 12:30 PM
Gold Elliott Wave View: 5 Waves Up

Gold Short Term Elliott Wave suggests that the rally from 8/15 low is unfolding as a zigzag. The first leg Minor wave A is subdivided as an impulse. Minute wave ((i)) of A ended at 1300.83, Minute wave ((ii)) of A ended at 1274.45, Minute wave ((iii)) of A ended at 1326, and Minute wave ((iv)) of A ended at 1297.52. Minute wave ((v)) of A is currently in progress and also subdivided as an impulse.

Minutte wave (i) of ((v)) ended at 1323.63, Minutte wave (ii) of ((v)) ended at 1316.3, and Minutte wave (iii) of ((v)) ended at 1339.77. Gold is currently in Minutte wave (iv) of ((v)) pullback before another leg higher to complete Minor wave A. Afterwards, Gold should pullback in Minor wave B to correct cycle from 8/15 low before the rally resumes. We don’t like selling Gold and expect buyers to appear once wave B pullback is over in 3, 7, or 11 swing as far as pivot at 8/15 low (1267.21) stays intact.

Gold 1 Hour Elliott Wave Chart
Ayoub Ben Rejeb غير متواجد حالياً  
رد مع اقتباس
عضو نشيط
 
تاريخ التسجيل: Dec 2013
الدولة: Tunisia
المشاركات: 282
خبرة السوق: أكثر من 5 سنوات
معدل تقييم المستوى: 13
Ayoub Ben Rejeb is on a distinguished road
افتراضي رد: Elliott Wave Analysis by EWF
173#
06 - 09 - 2017, 12:39 PM
AUDUSD Elliott Wave View: More Upside

AUDUSD Short Term Elliott Wave view suggests that the rally from 8/15 low is unfolding as a double three Elliott Wave structure. Up from 8/15 low, Minute wave ((w)) ended at 0.79957 and Minute wave ((x)) ended at 0.7868. Minute wave ((y)) is in progress and the subdivision also unfolds as a double three. Minutte wave (w) of ((y)) ended at 0.7995 and Minutte wave (x) of ((y)) ended at 0.793. Near term, while pullbacks stay above 0.793, but more importantly above 0.7868, expect pair to extend higher towards 0.806 – 0.8108. We don’t like selling the pair.

AUDUSD 1 Hour Elliott Wave Chart
Ayoub Ben Rejeb غير متواجد حالياً  
رد مع اقتباس
عضو نشيط
 
تاريخ التسجيل: Dec 2013
الدولة: Tunisia
المشاركات: 282
خبرة السوق: أكثر من 5 سنوات
معدل تقييم المستوى: 13
Ayoub Ben Rejeb is on a distinguished road
افتراضي رد: Elliott Wave Analysis by EWF
174#
06 - 09 - 2017, 02:43 PM
North Korea Nuclear test poses little threat to Indices rally

Geopolitical tensions intensified after North Korea conducted its sixth and most powerful nuclear test on Sunday, detonating what it said was a hydrogen bomb meant for intercontinental ballistic missile. The United States warned it could launch a “massive” military response if it or its allies were threatened. Most of the Stock Markets in the World reacted negatively to the news with stocks from around the World ending the day in the red.

We believe what we saw was some panic selling and not a huge sell off. We believe that markets move on the basis of cycles and swing sequences and news just acts as a catalyst rather than driving the markets. We believe North Korea’s nuclear test poses little threat to the rally in Indices as mid-long term cycles are still bullish. We will present long-term view in South Korean Stock Exchange to support our view that any sell off seen due to escalating geo-political tensions is still a buying opportunity.

$KOSPI-KOR denies huge sell off due to North Korea


KOSPI-KOR Index from South Korea is within 7th swing from 1980 low but has not yet reached the ideal target area. Sequence from 2008 low is also incomplete and calls for more upside towards 2891 – 3362 area as far as dips hold above 2011 low. As the sequence from 1980 and 2008 low in KOSPI-KOR is incomplete, any dips remain a buy in 3, 7 or 11 swings as far as pivot at 2011 low remains intact. North Korea’s nuclear test or any military offensive should have a direct impact on South Korea’s stock exchange and as the sequence is bullish, we believe nothing drastic will come out of the current scenario, it can cause a pull back but that should be a buying opportunity looking for a move higher towards 2891 – 3362 area.

$KOSPI-KOR Long-Term Elliott Wave View


$KOSPI-KOR rally from 1980 low could be viewed as a double three Elliott wave structure or it could be viewed to be in wave (III) of an incomplete Leading Diagonal structure. In either case, rally sequence is incomplete and as dips hold above wave ((2)) and more importantly “b” low, expect the Index to resume the rally towards 2893 – 3362 area to reach the extreme from 1980 low. From this area, Index can see a larger pull back to correct the cycle from 1980 low or at least from 2008 low labelled as (x) / (II). We don’t like selling the Index and expect to see buyers appearing after dips in 3, 7 or 11 swings as far as pivot at 2015 and 2011 lows remain intact.
Ayoub Ben Rejeb غير متواجد حالياً  
رد مع اقتباس
عضو نشيط
 
تاريخ التسجيل: Dec 2013
الدولة: Tunisia
المشاركات: 282
خبرة السوق: أكثر من 5 سنوات
معدل تقييم المستوى: 13
Ayoub Ben Rejeb is on a distinguished road
افتراضي رد: Elliott Wave Analysis by EWF
175#
07 - 09 - 2017, 01:50 PM
AUDUSD Elliott Wave View: Bullish above 0.787

AUDUSD Short Term Elliott Wave view suggests that the rally from 8/15 low is unfolding as a double three Elliott Wave structure. Up from 8/15 low, Minute wave ((w)) ended at 0.79957 and Minute wave ((x)) ended at 0.7868. Minute wave ((y)) is in progress and the subdivision also unfolds as a double three. Minutte wave (w) of ((y)) ended at 0.7995 and Minutte wave (x) of ((y)) ended at 0.793. Near term, while pullbacks stay above 0.793, but more importantly above 0.7868, expect pair to extend higher towards 0.806 – 0.8108. We don’t like selling the pair.

AUDUSD 1 Hour Elliott Wave Chart
Ayoub Ben Rejeb غير متواجد حالياً  
رد مع اقتباس
عضو نشيط
 
تاريخ التسجيل: Dec 2013
الدولة: Tunisia
المشاركات: 282
خبرة السوق: أكثر من 5 سنوات
معدل تقييم المستوى: 13
Ayoub Ben Rejeb is on a distinguished road
افتراضي رد: Elliott Wave Analysis by EWF
176#
07 - 09 - 2017, 02:15 PM
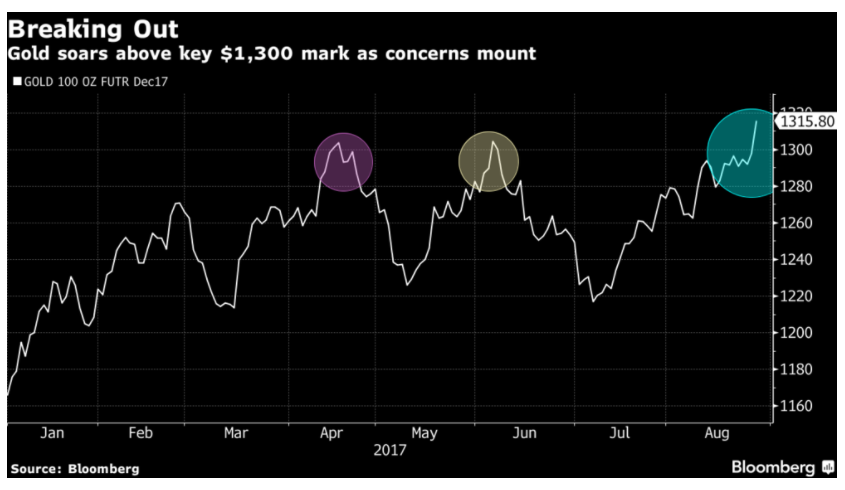
Gold Soars Above $1300 as Concerns Mount

Gold has tested $1300 level 3 times since April and it finally broke above the level on Monday and rose to the highest level this year. The trigger of the break seems to be the North Korea firing a ballistic missile over Japan, which boosts the safe haven demand. The yellow metal then extended the rally to 11 month high after North Korea nuke test. Gold’s strength, however, can not be attributed to just one event, but rather over a series of concerns which start to build a wall of worry among investors.


A few weeks ago, White House chief economic adviser Gary Cohn came close to resigning after president Trump’s response of blaming “both sides” in the deadly violence at Charlottesville, Virginia. Mr. Cohn is the main architect of President Trump’s tax reform agenda, and thus when news of his possible departure started to circulate around Aug 17, markets were spooked. Then there are also concerns of government shutdown if the debt ceiling is not raised. If this happens, it will trigger technical default on U.S debt.

Apart from the argument of safe haven demand, Gold for some people is considered as the best form of sound money. Unlike fiat money which can be printed ex nihilo, Gold has limited quantities. It has survived thousands of years as a form of money, longer than any other alternative forms of payment. The chart below compares Gold’s role as store value vs the fiat:


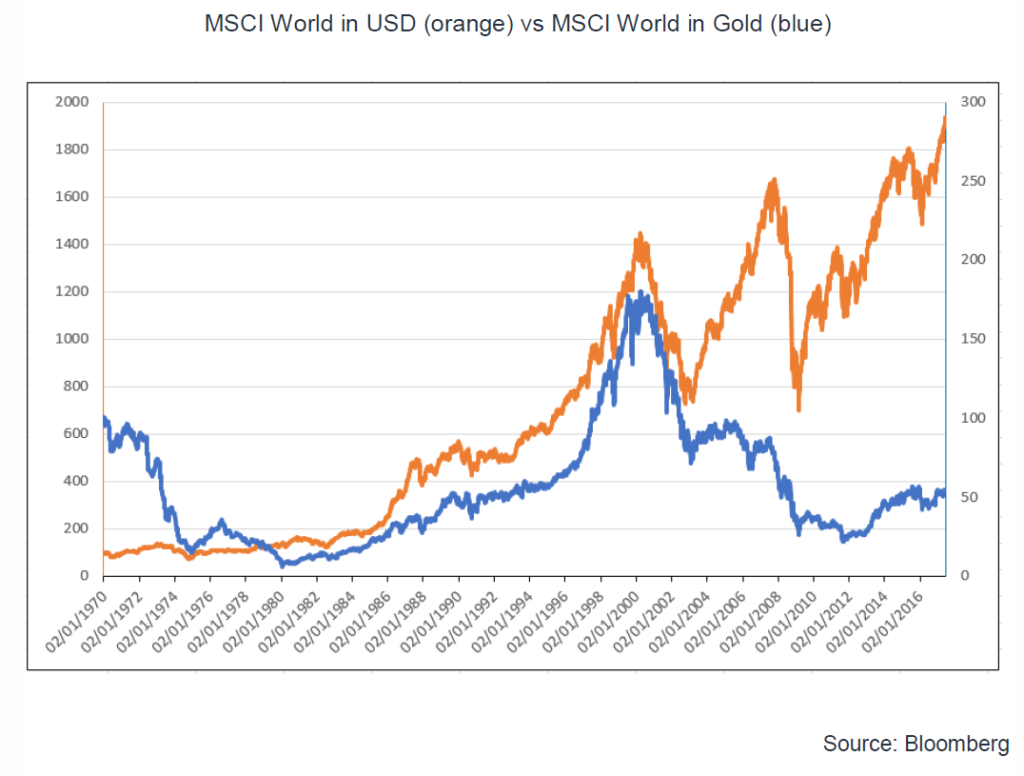
The chart above shows that while equity markets are hitting all-time highs in USD term, it peaked against Gold in 2000 and remain 70% below the peak.

We believe Gold’s dual role as sound money and safe haven demand will become more prominent in the next coming months as the massive Quantitative Easing experiment by central banks around the world start to reveal the true costs. This month, we shall also see the market reaction to the U.S. Fed’s plans to normalize their balance sheet and taper bonds reinvestment. On paper, this is the same as money tightening and thus could have the opposite effect of money printing.

Gold Daily Elliottwave Sequence Chart


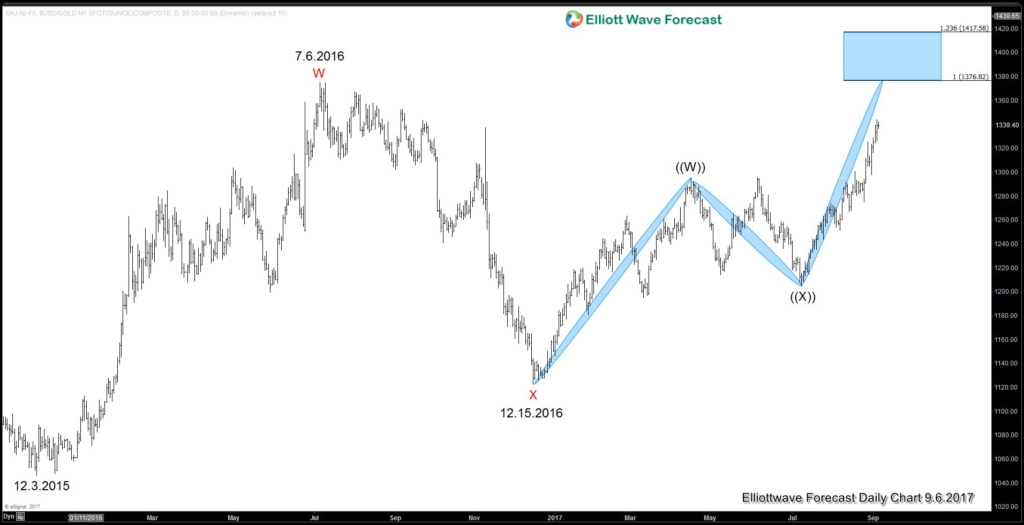
The Daily Chart of Gold shows the sequence from 12.15.2016 is bullish and favors more upside towards 1376.8 – 1417.6. When Gold reaches this area, it will also break above 7.6.2016 peak at 1375.15 which opens another larger bullish sequence from 12.3.2015 low. Thus, we don’t like selling Gold in any pullback and prefer to buy dips in 3, 7, or 11 swing.
Ayoub Ben Rejeb غير متواجد حالياً  
رد مع اقتباس
عضو نشيط
 
تاريخ التسجيل: Dec 2013
الدولة: Tunisia
المشاركات: 282
خبرة السوق: أكثر من 5 سنوات
معدل تقييم المستوى: 13
Ayoub Ben Rejeb is on a distinguished road
افتراضي رد: Elliott Wave Analysis by EWF
177#
11 - 09 - 2017, 06:35 PM
GBPUSD Elliott Wave View: More Upside

GBPUSD Short Term Elliott Wave view suggests that the rally from 8/24 low is unfolding as an impulse Elliott Wave structure. Up from 8/24 low (1.2773), Minor wave 1 ended at 1.2979 and Minor wave 2 ended at 1.2851. Minor wave 3 is in progress and the subdivision is unfolding as an impulse Elliott Wave structure. Minute wave ((i)) of 3 ended at 1.2947, Minute wave ((ii)) of 3 ended at 1.2907, Minute wave ((iii)) of 3 ended at 1.3082 and Minute wave ((iv)) of 3 ended at 1.303. Minute wave ((v)) of 3 is expected to end soon within 1.3104 – 1.3182 area. Afterwards, pair should pullback in Minor wave 4 before the rally resumes. We don’t like selling the proposed pullback.

GBPUSD 1 Hour Elliott Wave Chart
Ayoub Ben Rejeb غير متواجد حالياً  
رد مع اقتباس
عضو نشيط
 
تاريخ التسجيل: Dec 2013
الدولة: Tunisia
المشاركات: 282
خبرة السوق: أكثر من 5 سنوات
معدل تقييم المستوى: 13
Ayoub Ben Rejeb is on a distinguished road
افتراضي رد: Elliott Wave Analysis by EWF
178#
11 - 09 - 2017, 06:39 PM
Under Armour UAA Weekly Elliott Wave Outlook

Under Armour (NYSE: UAA) is one of the leading sporstwear companies around the world. However it’s stock has been struggling in the recent 2 years as it lost %68 since September 2015.

In our previous article, we pointed out to the current correction taking place which could turn out to be 3 waves flat structure. It turned out to be the case for UAA and the stock currently extending lower into the 123.6% – 1.618% fib ext area (21.49 – 13.32) where it’s expected to end the correction in wave ((II)) and resume higher or bounce in 3 waves at least.

UAA can extend further toward 10.98 which is the target for wave I = wave V but we need to be aware that it has already enough number of swings in place to end the cycle from 09/17/2015. That’s why it’s not recommended to chase the short side at current stage.

Overall, UAA will remain under pressure until it manage to break the short term pivot of wave IV at 23.46 as a first step then we’ll be looking for the next leg higher to take it above $52 or fail below it for a double correction taking place in a later stage.

UAA Weekly Chart
Ayoub Ben Rejeb غير متواجد حالياً  
رد مع اقتباس
عضو نشيط
 
تاريخ التسجيل: Dec 2013
الدولة: Tunisia
المشاركات: 282
خبرة السوق: أكثر من 5 سنوات
معدل تقييم المستوى: 13
Ayoub Ben Rejeb is on a distinguished road
افتراضي رد: Elliott Wave Analysis by EWF
179#
11 - 09 - 2017, 06:54 PM
INSM Insmed Inc Stock Skyrocketed

INSM Insmed Inc Stock Skyrocketed by a staggering 120% higher recently.

According to Nasdaq.com, the Insmed Inc. INSM stock advanced more than double in the pre-market trading after the company announced that its new drug, an inhaled antibiotic known as Alis, successfully treated patients with a rare lung disease. More specifically:

Alis met the main goal in a late-stage study involving 336 adult patients with nontuberculous mycobacterial lung infections. According to Insmed, the addition of the drug showed statistically significant reduction in bacterial density by month six in 29% of patients, compared to just 9% in patients receiving the standard treatment.

INSM Insmed Inc Stock Skyrocketed – Weekly Time Frame

Without any further delays lets take a look at the Weekly Chart. Price has extended from the all time lows at 2.60 suggesting cycle from 08/28/2000 has been completed and should see at this stage a correction against the 199.22 highs. And of course is too early too make huge calls, the reason we are going to take it step by step.

At this stage and as the following chart indicates, INSM has extended with waves iii red while in 3rd swing up for ((w)). Short cycles we should see a short term pull back and from there extend higher again to reach the equal legs – 1.236% extension at the zone of 34.80’s – 40.90’s before sellers appear. The view comes inline with our analysis relating to IBB and XLV ETF’s while both Funds are looking for additional extension higher. So at this point we are looking for the dip in wave iv red to trigger Long entries towards the targets higher as mentioned above.

INSM Insmed Inc Stock Skyrocketed - Weekly Time Frame
Ayoub Ben Rejeb غير متواجد حالياً  
رد مع اقتباس
عضو نشيط
 
تاريخ التسجيل: Dec 2013
الدولة: Tunisia
المشاركات: 282
خبرة السوق: أكثر من 5 سنوات
معدل تقييم المستوى: 13
Ayoub Ben Rejeb is on a distinguished road
افتراضي رد: Elliott Wave Analysis by EWF
180#
12 - 09 - 2017, 05:19 PM
[LEFT]
DXY Dollar Index Elliott Wave View: 9.12.2017

DXY Dollar Index Short Term Elliott Wave view suggests that the decline from 8/16 peak is unfolding as an Ending Diagonal Elliott Wave structure. Down from 8/16 high, Minor wave 1 ended at 91.62 and Minor wave 2 ended at 93.347. Minor wave 3 is unfolding as a double three Elliottwave structure. Minute wave ((w)) of 3 ended at 91.01 and Minute wave ((x)) of 3 is in progress. The internal subdivision of Minute wave ((x)) shows a zigzag Elliottwave structure. Minutte wave (a) of ((x)) ended at 91.62 and Minutte wave (b) of ((x)) ended at 91.41.

The Index has reached an inflection area where Minutte wave (c) = Minutte wave (a) and thus cycle from 9/8 low is mature. Expect Minute wave ((x)) of 3 to end at 92.02 – 92.4. While bounces stay below 93.36, Index should resume lower or at least pullback in 3 waves. We don’t like buying the Dollar Index.

DXY 1 Hour Elliott Wave Chart
Ayoub Ben Rejeb غير متواجد حالياً  
رد مع اقتباس


إضافة رد

الكلمات الدلالية (Tags)
commodity, elliott wave, forex, stocks


جديد مواضيع منتدى تداول العملات العام

المواضيع المتشابهه
الموضوع كاتب الموضوع المنتدى مشاركات آخر مشاركة
elliott wave Nnana123 منتدى تداول العملات العام 6 11 - 04 - 2015 07:07 PM


11:30 AM