• 10:52 مساءاً


Elliott Wave Analysis by EWF

إضافة رد
Like Tree17Likes

أدوات الموضوع
عضو نشيط
 
تاريخ التسجيل: Dec 2013
الدولة: Tunisia
المشاركات: 282
خبرة السوق: أكثر من 5 سنوات
معدل تقييم المستوى: 13
Ayoub Ben Rejeb is on a distinguished road
افتراضي رد: Elliott Wave Analysis by EWF
151#
09 - 08 - 2017, 01:19 PM
FTSE 100 Elliott Wave View: Pullback expected

Short term FTSE 100 ( UKX-FTSE ) Elliott Wave view suggests that Minor wave B ended on 6/30 low 7302.7 and the rally from there is unfolding as a double three Elliott wave structure where wave ((w)) ended at 7515.12 and wave ((x)) pullback ended at 7338.2. Index has reached 100% from 6/30 low so cycle is mature and Minor wave 1 can be complete anytime. Expect the Index to pullback in Minor wave 2 soon to correct cycle from 6/30 low before the rally resumes. As far as pivot at 7302.7 low remains intact, Index should find buyers within Minor wave 2 dips in the sequence of 3, 7, or 11 swing for further upside. If pivot at 7302.7 low fails during later pullback, the Index would be still remain in the same cycle from 6/2 peak. Index should then extend the correction to the downside. We don’t like selling the Index.

FTSE 1 Hour Elliott Wave Chart

Ayoub Ben Rejeb غير متواجد حالياً  
رد مع اقتباس

عضو نشيط
 
تاريخ التسجيل: Dec 2013
الدولة: Tunisia
المشاركات: 282
خبرة السوق: أكثر من 5 سنوات
معدل تقييم المستوى: 13
Ayoub Ben Rejeb is on a distinguished road
افتراضي رد: Elliott Wave Analysis by EWF
152#
14 - 08 - 2017, 01:04 PM
Gold Elliott Wave View: More Upside

Short term Gold (XAUUSD) Elliott Wave view suggests that rally from 7/10 low is unfolding as a a double three Elliott wave structure. Up from 7/10 low (1204.69), Minor wave W ended at 1274.11 and pullback to 1251.27 ended Minor wave X. Wave Y is currently in progress as a zigzag Elliott wave structure where Minute wave ((a)) is expected to complete with one more leg higher and can reach as high as 1294.3 – 1304.6, then it should pullback in Minute wave ((b)) before the rally resumes, We don’t like selling Gold and expect buyers to appear again after Minute wave ((b)) pullback is complete in 3, 7, or 11 swing, provided pivot at 1251.27 low remains intact.

Gold 1 Hour Elliott Wave Chart

Ayoub Ben Rejeb غير متواجد حالياً  
رد مع اقتباس
عضو نشيط
 
تاريخ التسجيل: Dec 2013
الدولة: Tunisia
المشاركات: 282
خبرة السوق: أكثر من 5 سنوات
معدل تقييم المستوى: 13
Ayoub Ben Rejeb is on a distinguished road
افتراضي رد: Elliott Wave Analysis by EWF
153#
15 - 08 - 2017, 01:16 PM
Dow Future Elliott Wave View: Resuming Higher

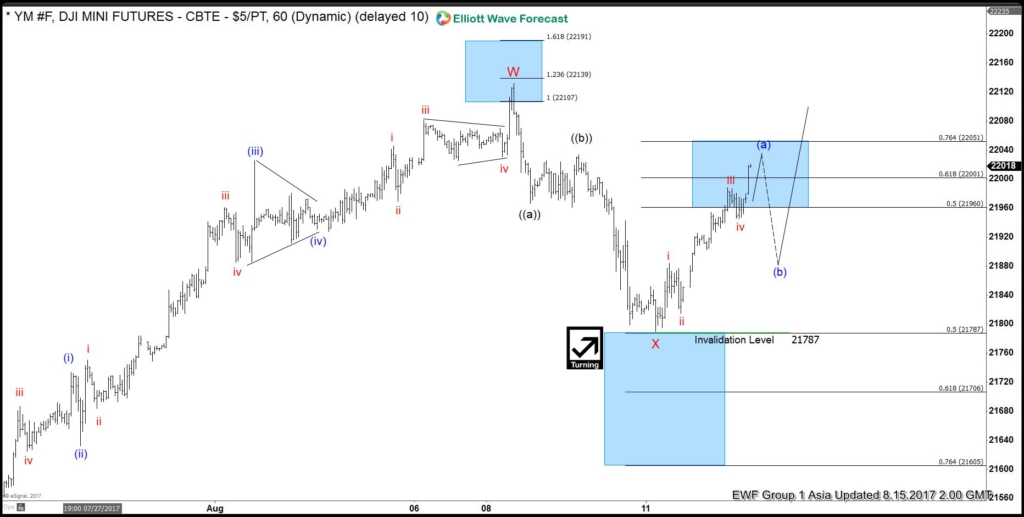
Short term Dow Futures (YM_F) Elliott Wave view suggests that rally from 6/29 low is unfolding as a a double three Elliott wave structure. Up from 6/29 low (21138), Minor wave W ended at 22132 and pullback to 21790 ended Minor wave X. Rally from there is unfolding as an impulse Elliott wave structure. Up from 21790, Subminutte wave i ended at 21884, Subminutte wave ii ended at 21815, Subminutte wave iii ended at 21988 and Subminutte wave iv ended at 21946. Expect Subminutte wave v of (a) to complete soon and thus cycle from 8/11 low to end. Index should then pullback in Minutte wave (b) to correct cycle from 8/11 low before resuming higher again. We don’t like selling the proposed pullback and expect buyers to appear once Minutte wave (b) pullback is complete in 3, 7, or 11 swing provided pivot at 21787 low stays intact.

Dow Future 1 Hour Elliott Wave Chart
Ayoub Ben Rejeb غير متواجد حالياً  
رد مع اقتباس
عضو نشيط
 
تاريخ التسجيل: Dec 2013
الدولة: Tunisia
المشاركات: 282
خبرة السوق: أكثر من 5 سنوات
معدل تقييم المستوى: 13
Ayoub Ben Rejeb is on a distinguished road
افتراضي رد: Elliott Wave Analysis by EWF
154#
16 - 08 - 2017, 01:29 PM
Dow Futures Elliott Wave View: 3 waves pullback

Short term Dow Futures (YM_F) Elliott Wave view suggests that rally from 6/29 low is unfolding as a a double three Elliott wave structure. Up from 6/29 low (21138), Minor wave W ended at 22132 and pullback to 21790 ended Minor wave X. Rally from there is unfolding as an impulse Elliott wave structure. Up from 21790, Subminutte wave i ended at 21884, Subminutte wave ii ended at 21815, Subminutte wave iii ended at 21988, Subminutte wave iv ended at 21946, and Subminutte wave v of (a) ended at 22034. Minutte wave (b) is in progress to correct cycle from 8/11 low in 3, 7, or 11 swing before the Index resumes the rally. We don’t like selling the proposed pullback and expect buyers to appear once Minutte wave (b) pullback is complete in 3, 7, or 11 swing provided pivot at 21787 low stays intact.

Dow Futures 1 Hour Elliott Wave Chart
Ayoub Ben Rejeb غير متواجد حالياً  
رد مع اقتباس
عضو نشيط
 
تاريخ التسجيل: Dec 2013
الدولة: Tunisia
المشاركات: 282
خبرة السوق: أكثر من 5 سنوات
معدل تقييم المستوى: 13
Ayoub Ben Rejeb is on a distinguished road
افتراضي رد: Elliott Wave Analysis by EWF
155#
17 - 08 - 2017, 02:10 PM
USDX Elliott wave view: Double three

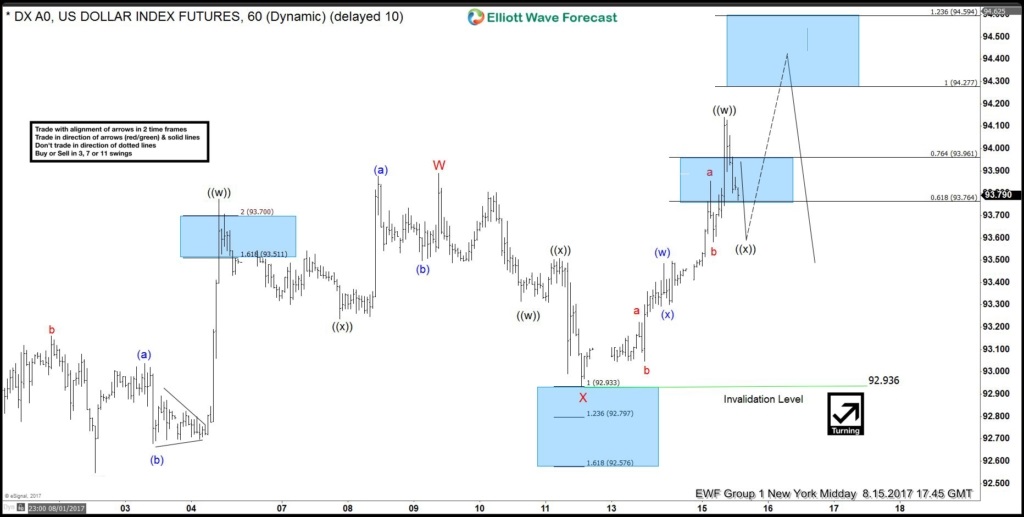
Short term USDX index Elliott Wave view suggests that the decline to 8/02 (92.54) low ended intermediate wave (3) then the rally from there is unfolding as a a double three Elliott wave structure. As the structure from the 8/02 looks to be overlapping, hence suggesting it’s corrective structure, either W,X,Y or W,X,Y,Z.

Where the first leg higher ended in Minor wave W at 93.77 & pullback to 92.93 low ended Minor wave X. Minor wave Y currently in progress as double three structure , where Minute wave ((w)) ended at today’s peak 94.04. And while near term dips remains above 92.93 low index has scope to extend 1 more push higher towards 94.27-94.59 100%-123.6% fibonacci extension area to end the cycle from 8/02 lows in intermediate wave (4) bounce then index has scope to resume the decline or should do a 3 waves pullback at least ( if it continues to extend higher later on as W,X,Y,Z). However we don’t like buying the index and expect seller’s to appear again in between 94.27-94.59 area for more downside or for 3 waves pullback at least.

USDX 1 Hour Elliott Wave Chart

Ayoub Ben Rejeb غير متواجد حالياً  
رد مع اقتباس
عضو نشيط
 
تاريخ التسجيل: Dec 2013
الدولة: Tunisia
المشاركات: 282
خبرة السوق: أكثر من 5 سنوات
معدل تقييم المستوى: 13
Ayoub Ben Rejeb is on a distinguished road
افتراضي رد: Elliott Wave Analysis by EWF
156#
17 - 08 - 2017, 02:25 PM
Dow Futures Elliott Wave View 8.17.2017

Short term Dow Futures (YM_F) Elliott Wave view suggests that rally from 6/29 low is unfolding as a a double three Elliott wave structure. Up from 6/29 low (21138), Minor wave W ended at 22132 and pullback to 21790 ended Minor wave X. Rally from there is unfolding as an impulse Elliott wave structure. Up from 21790, Subminutte wave i ended at 21884, Subminutte wave ii ended at 21815, Subminutte wave iii ended at 22034, Subminutte wave iv ended at 21942, and Subminutte wave v of (a) ended at 22067. Minutte wave (b) is in progress to correct cycle from 8/11 low in 3, 7, or 11 swing before the Index resumes the rally. We don’t like selling the proposed pullback and expect buyers to appear once Minutte wave (b) pullback is complete in 3, 7, or 11 swing provided pivot at 21787 low stays intact.

Dow Futures 1 Hour Elliott Wave Chart
Ayoub Ben Rejeb غير متواجد حالياً  
رد مع اقتباس
عضو نشيط
 
تاريخ التسجيل: Dec 2013
الدولة: Tunisia
المشاركات: 282
خبرة السوق: أكثر من 5 سنوات
معدل تقييم المستوى: 13
Ayoub Ben Rejeb is on a distinguished road
افتراضي رد: Elliott Wave Analysis by EWF
157#
18 - 08 - 2017, 11:48 AM
Dow Futures Elliott Wave view 8.18.2017

Short term Dow Futures (YM_F) Elliott wave view suggest that the rally to 8/08 peak 22177 ended the “Cycle” from Feb 11, 2016 low. The decline from there is unfolding as an impulse suggesting the index could be following a Elliott Wave Zigzag pattern in larger degree correction. From there Intermediate wave (1) ended at 21789 in 5 waves at 21789 low and bounce from there ended in 3 swings at 22070 peak as another zigzag pattern within intermediate wave (2).

The decline from there is unfolding as an impulse Elliott wave structure within intermediate wave (3). Below from 21789 peak, Minor wave 1 ended at 21993, Minor wave 2 ended at 22034 peak. Below from there Minute wave ((i)) ended at 21885, Minute wave ((ii)) ended at 21950, Minute wave ((iii)) ended at 21705 low and above from there doing a Minute wave ((iv)) bounce. Which is expected to unfold in 3 swings and shouldn't pass the 0.382% Fibonacci retracement area 21798 of Minute wave ((iii)) for the idea to remain alive for further downside in Minute wave ((v)) of 3 lower initially. We don’t like selling the pullback and expect further downside extension as far as pivot from 22070 peak & more importantly from 22177 peak remains intact to continue correction lower.

Dow Futures 1 Hour Elliott Wave Chart

Ayoub Ben Rejeb غير متواجد حالياً  
رد مع اقتباس
عضو نشيط
 
تاريخ التسجيل: Dec 2013
الدولة: Tunisia
المشاركات: 282
خبرة السوق: أكثر من 5 سنوات
معدل تقييم المستوى: 13
Ayoub Ben Rejeb is on a distinguished road
افتراضي رد: Elliott Wave Analysis by EWF
158#
22 - 08 - 2017, 01:54 PM
USDJPY Elliott Wave View: Ending bounce

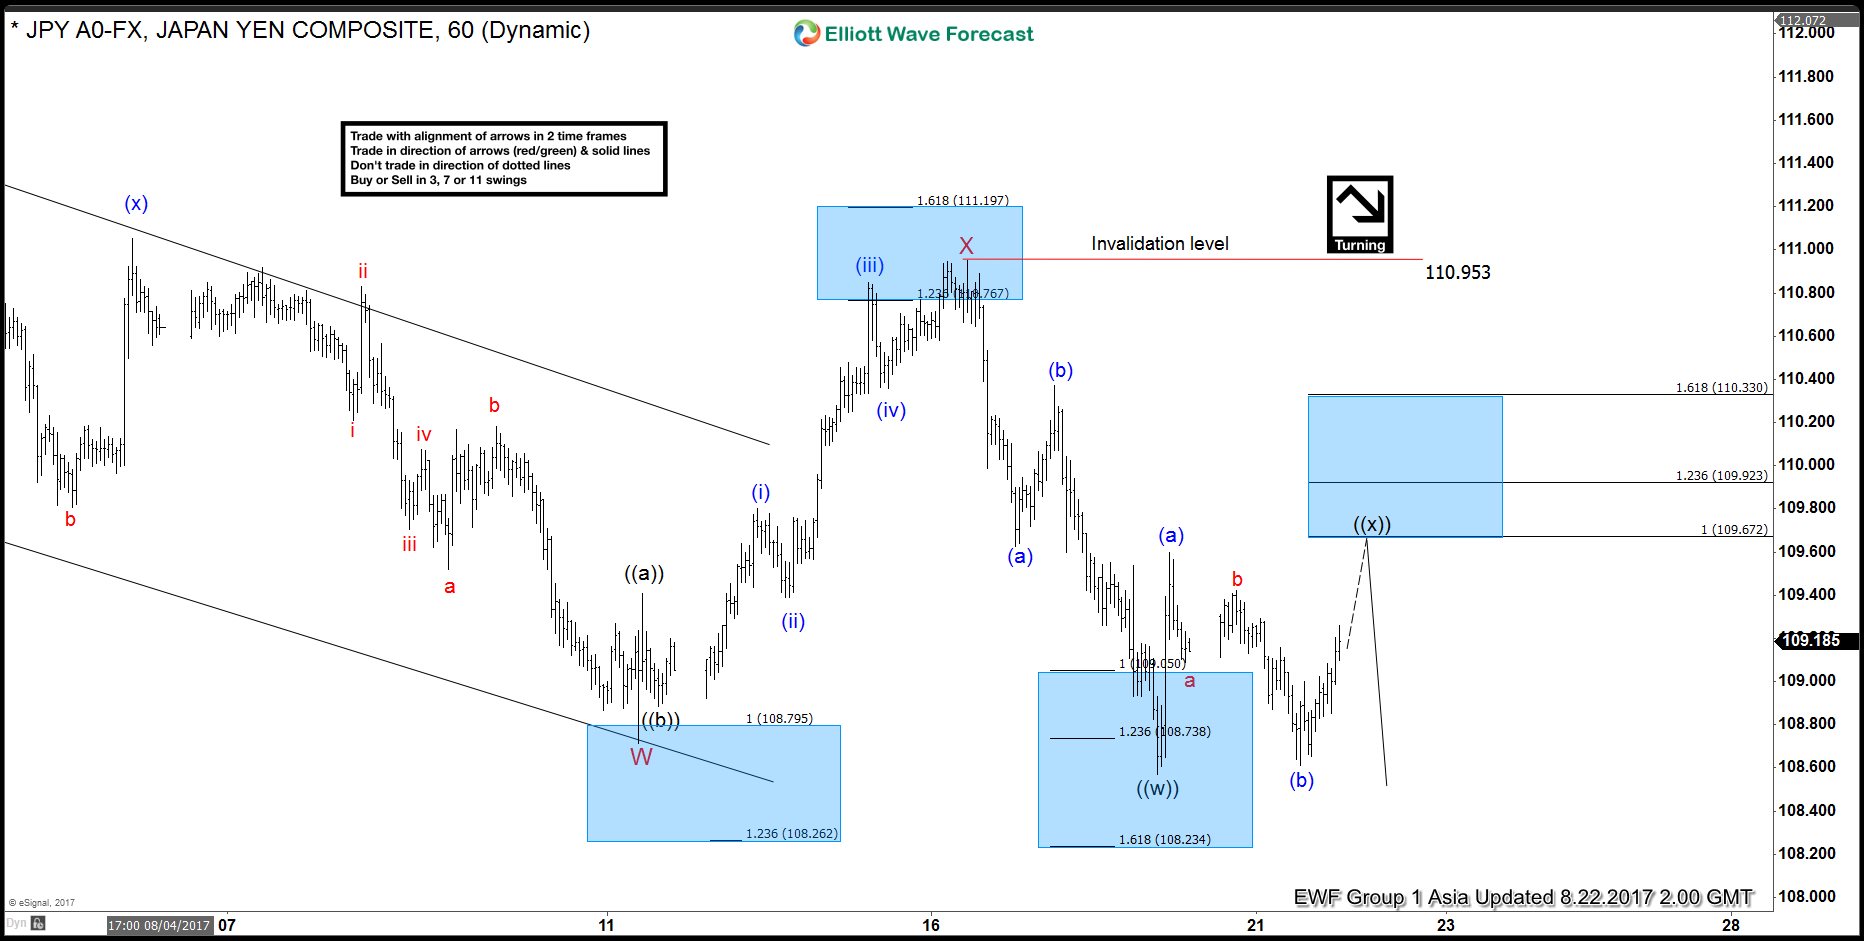
Short term USDJPY Elliott wave view suggest that the decline from 7/11 peak is unfolding as a double three Elliott wave structure. Decline to 108.71 low ended Minor wave W and correction of that cycle ended in a Minor wave X at 110.95 peak. Subdivision of Minor wave Y is unfolding as a Zigzag structure. Minute wave ((w)) of ((Y) ended at 108.59 low and Minute wave ((x)) of (Y) bounce is in progress as another Zigzag structure.

Up from 108.59 wave ((w)) low, Minutte wave (a) of ((x)) ended at 109.6 peak and Minutte wave (b) of ((x)) pullback ended at 108.609. Above from there, Minutte wave (c) of ((x)) is in progress towards 109.67-109.92 or 100%-123.6% Fibonacci extension area of (a)-(b). Afterwards, pair should resume the decline or pullback in 3 swings at least. We don’t advise buying the pair into the bounce. Expect sellers to appear after Minute wave ((x)) bounce is complete in 3, 7 or 11 swings for further downside, provided pivot at 110.95 peak stays intact.

1 Hour USDJPY Elliott Wave Chart
Ayoub Ben Rejeb غير متواجد حالياً  
رد مع اقتباس
عضو نشيط
 
تاريخ التسجيل: Dec 2013
الدولة: Tunisia
المشاركات: 282
خبرة السوق: أكثر من 5 سنوات
معدل تقييم المستوى: 13
Ayoub Ben Rejeb is on a distinguished road
افتراضي رد: Elliott Wave Analysis by EWF
159#
22 - 08 - 2017, 02:08 PM
HPQ HP Inc Earnings Report and Price Analysis for 08/23/17

According to Nasdaq.com, NYSE HPQ HP Inc. is expected to report earnings on 08/23/2017 after market close. The report will be for the fiscal Quarter ending Jul 2017. According to Zacks Investment Research, based on 6 analysts’ forecasts, the consensus EPS forecast for the quarter is $0.42. The reported EPS for the same quarter last year was $0.48. Last quarter, the company posted a positive earnings surprise of 2.6%. Notably, the stock surpassed the Zacks Consensus Estimate thrice and came in line once, over the trailing four quarters. It has an average positive earnings surprise of 3%.

Few Words about NYSE:HPQ. HP Inc. (also known as Hewlett Packard) is an American technology company leading as a global provider in computing and imaging solutions and services for business and home. The company is focused on capitalizing on the opportunities of the Internet and the proliferation of electronic services. Its major businesses include Imaging and Printing Systems, Computing Systems and Information Technology Services. HPQ was formed on November 1, 2015 out of the personal computer and printer divisions of the original Hewlett-Packard Company, with its enterprise products and services businesses becoming Hewlett Packard Enterprise. The split was structured so that Hewlett-Packard changed its name to HP Inc. and spun off Hewlett Packard Enterprise as a new publicly traded company. HP Inc. retains Hewlett-Packard’s pre-2015 stock price history and its former stock ticker symbol, HPQ, while Hewlett Packard Enterprise trades under its own symbol, HPE.

Regarding the coming earnings, Zacks.com model does not support that HP will likely beat the Zacks Consensus Estimate in its upcoming release due to that fact that Earnings ESP, which represents the difference between the Most Accurate estimate and the Zacks Consensus Estimate, is currently pegged at 0.00%. This is because the Most Accurate estimate of 42 cents comes in line with the Zacks Consensus Estimate. One more reason for the above assumption is that HP carries a Zacks Rank #2. Though this increases the predictive power of ESP, the company’s ESP of 0.00% makes surprise prediction difficult.

Despite that, many analyst hold Bullish HPQ due to the following reasons:
HP is the leader in Printing Company World Wide especially after September 12, 2016 announcement that Hewlett Packard NYSE:HPQ set to buy Samsung Electronics’ OTCSNLF printer business for a cash payment of $1.05 billion. The acquisition is expected to close in 2017 and is expected to be accretive in the first full year following closing. After closing, Samsung has agreed to make a $100 million to $300 million equity investment in HP through open market purchases.
Numerous Studies surfing the internet indicating by various Price Valuation Models, HPQ Stock price still remains relatively undervalued.

When it comes to our view relating to NYSE:HPQ, in the weekly time frame we remain overall Bullish the Stock. At this stage we would like to see a break above the multi year descending trend line around the 20’s and from there expect price to extend to the 22’s – 25’s area to reach the equal legs – 1.236% extension from the 11/19/2012 cycle’s lows at 5.16 before price could see sellers and correct lower. Note, HPQ can see a continuation in the pull back towards the supporting trendline around the level of 17.80’s before extend higher or see at least a 3 wave bounce against the highs at 19.60’s.

HPQ HP Inc Weekly
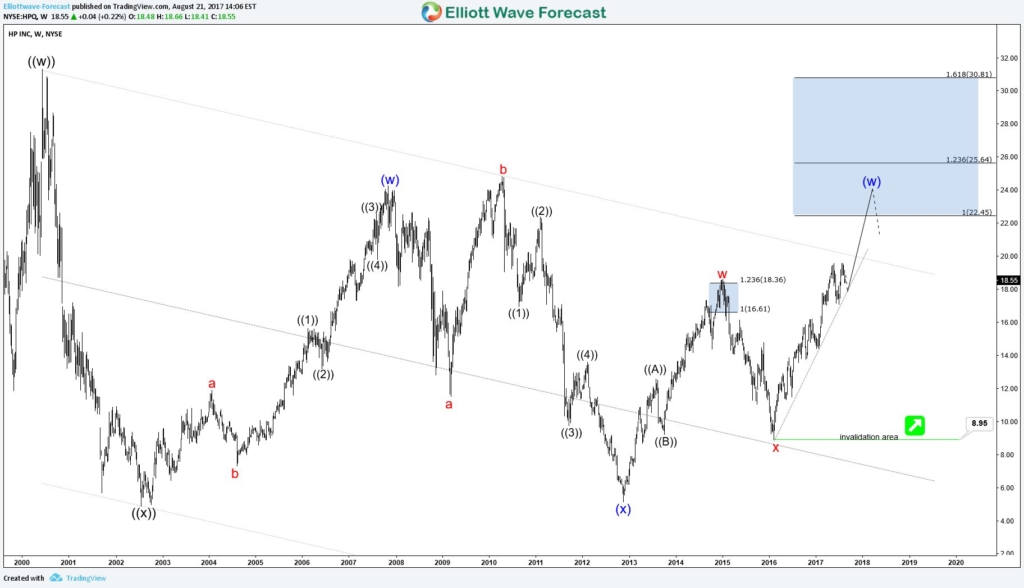

In the case of new highs above 24.85’s (wave b red) then the Stock will mark a incomplete bullish sequence in the weekly time frame from 07/22/2002 and from there recommend the buying the dips in 3 7 or 11 swings.
Ayoub Ben Rejeb غير متواجد حالياً  
رد مع اقتباس
عضو نشيط
 
تاريخ التسجيل: Dec 2013
الدولة: Tunisia
المشاركات: 282
خبرة السوق: أكثر من 5 سنوات
معدل تقييم المستوى: 13
Ayoub Ben Rejeb is on a distinguished road
افتراضي رد: Elliott Wave Analysis by EWF
160#
23 - 08 - 2017, 02:14 PM
USDJPY Elliott Wave View: Turning Lower

Short term USDJPY Elliott wave view suggest that the decline from 7/11 peak is unfolding as a double three Elliott wave structure. Decline to 108.71 low ended Minor wave W and Minor wave X bounce ended at 110.95 peak. Subdivision of Minor wave Y is unfolding as a Zigzag structure. Minute wave ((w)) of ((Y) ended at 108.59 low and Minute wave ((x)) of (Y) bounce is proposed complete at 109.82.

However, a break below 108.59 is needed to add conviction to this view. Until then a double correction in Minutte wave ((x)) can’t be ruled out. Near term, as far as pivot from 110.95 peak stays intact, expect pair to extend lower in Minute wave ((y)) or pullback in 3 waves at least. We don’t advise buying the pair and expect more downside in the pair towards 107.46-106.92 area next before a bounce is seen.

USDJPY 1 Hour Elliott Wave Chart
Ayoub Ben Rejeb غير متواجد حالياً  
رد مع اقتباس


إضافة رد

الكلمات الدلالية (Tags)
commodity, elliott wave, forex, stocks


جديد مواضيع منتدى تداول العملات العام

المواضيع المتشابهه
الموضوع كاتب الموضوع المنتدى مشاركات آخر مشاركة
elliott wave Nnana123 منتدى تداول العملات العام 6 11 - 04 - 2015 07:07 PM


10:52 PM