• 11:30 صباحاً


Elliott Wave Analysis by EWF

إضافة رد
Like Tree17Likes

أدوات الموضوع
عضو نشيط
 
تاريخ التسجيل: Dec 2013
الدولة: Tunisia
المشاركات: 282
خبرة السوق: أكثر من 5 سنوات
معدل تقييم المستوى: 13
Ayoub Ben Rejeb is on a distinguished road
افتراضي رد: Elliott Wave Analysis by EWF
191#
03 - 10 - 2017, 06:59 PM
MU Micron Technology INC – Buy the Next Dip

Today we are going to take a look at the weekly chart of the MU Micron Technology Inc. stock which shows a very interesting price structure.

Before we proceed with the analysis, few words about the company. According to Wikipedia, Micron Technology Inc. is an American global corporation based in Boise, Idaho. Furthermore the company produces many forms of semiconductor devices, including dynamic random-access memory, flash memory, and solid-state drives. It’s consumer products are marketed under the brands Crucial Technology and Lexar. Micron and Intel together created IM Flash Technologies, which produces NAND flash memory.

By looking at the Stock price, 2016 and 2017 have been great years for MU. The stock has achieved an 400% parabolic extension to date from the lows at 9.31. The surge in the stock’s price is affiliated mostly to the company’s revenue growth in both sequential and annual basis.

We won’t get into more details with Micron’s very good economic condition but instead focus on the company’s stock.

MU Micron Technology – Weekly Chart


The MU stock has a bullish incomplete sequence from the 11/17/2008 lows at 1.59. Additionally has a bullish sequence from the 2016 lows as well indicating 5 waves for wave ((A)). The 2008 sequence is in effect after breaking above the 12/2014 peak at 36.59. The second after taking the ((A)) peak at 32.33. After short term pull backs the Stock should continue extending higher until reach the equal legs – 1.236% extension of the w – x in red swing at the 42.50’s – 50.34 zone. Additionally, the stock should extend to the 2016 cycle ((A)) – ((B)) equal legs – 1.236% extension to the 50.34 – 56 zone.

From there we should see a larger degree pull back in (x) but at this point to soon to create any calls for that correction.
Ayoub Ben Rejeb غير متواجد حالياً  
رد مع اقتباس

عضو نشيط
 
تاريخ التسجيل: Dec 2013
الدولة: Tunisia
المشاركات: 282
خبرة السوق: أكثر من 5 سنوات
معدل تقييم المستوى: 13
Ayoub Ben Rejeb is on a distinguished road
افتراضي رد: Elliott Wave Analysis by EWF
192#
05 - 10 - 2017, 06:06 PM
Nikkei ( NKD_F) Elliott Wave View: Diagonal Structure

Short term Elliott wave view in Nikkei suggest that the cycle from August 29.2017 low (19055) is unfolding in 5 waves pattern. However looking at the internal subdivision of each wave the bounce looks corrective in nature with upside extensions. Thus suggesting that the Nikkei cycle from August 29 low (19055) could be following a leading Diagonal pattern in Minor wave A higher.

Where Minute wave ((i)) ended at 19740 peak as a flat structure, Minute wave ((ii)) ended at 19229. Minute wave ((iii)) ended at 20496 peak in 3 swings as zigzag structure. Where Minutte wave (a) ended at 19898 and Minutte wave (b) at 19765 low. Minute wave (((iv)) ended at 20131 low. From there Minute wave ((v)) remains in progress in 3 swings, where Minutte wave (w) ended at 20460, Minutte wave (x) at 20305 low. While above 20131 low, Index is expected to see further strength towards 20630 – 20707 to complete wave ((v)) of the Diagonal structure and then it should pull back in 3 waves at least. RSI divergence with respect to wave ((iii)) should remain intact with the next push higher for the diagonal ideal to remain valid. If RSI divergence is erased, then structure would become a triple three Elliott wave structure.

Nikkei 4 Hour Elliott Wave Chart
Ayoub Ben Rejeb غير متواجد حالياً  
رد مع اقتباس
عضو نشيط
 
تاريخ التسجيل: Dec 2013
الدولة: Tunisia
المشاركات: 282
خبرة السوق: أكثر من 5 سنوات
معدل تقييم المستوى: 13
Ayoub Ben Rejeb is on a distinguished road
افتراضي رد: Elliott Wave Analysis by EWF
193#
06 - 10 - 2017, 01:03 PM
EURUSD Intra-Day Elliott Wave Analysis

EURUSD Intra-Day Elliott Wave view suggests the decline from 9/8 peak remains in progress as an expanded Flat Elliott Wave structure. Down from 9/8 high (1.2094), pair ended Intermediate wave (A) at 1.837. Bounce to 1.2034 ended Intermediate wave (B). Intermediate wave (C) remains in progress and unfolding as 5 waves impulse where Minor wave 1 of (C) ended at 1.186, and Minor wave 2 of (C) ended at 1.2. Down from there, Minor wave 3 of (C) ended at 1.1716 and bounce to 1.1832 ended Minor wave 4 of (C).

While EURUSD stays below 1.1789, it has scope to extend lower in Minor wave 5 of (C) and reach 1.1586 – 1.1633 area. The move lower will also end cycle from 9/8 peak and complete Primary wave ((W)). Afterwards, Pair should bounce in Primary wave ((X)) to correct cycle from 9/8 peak in 3, 7, or 11 swing at least. If pair breaks above 1.17899 from here without making a new low, pair may have ended Primary wave ((W)) already.

EURUSD 1 Hour Elliott Wave Chart
Ayoub Ben Rejeb غير متواجد حالياً  
رد مع اقتباس
عضو نشيط
 
تاريخ التسجيل: Dec 2013
الدولة: Tunisia
المشاركات: 282
خبرة السوق: أكثر من 5 سنوات
معدل تقييم المستوى: 13
Ayoub Ben Rejeb is on a distinguished road
افتراضي رد: Elliott Wave Analysis by EWF
194#
10 - 10 - 2017, 01:15 PM
NZDUSD Short-term Elliott Wave Analysis

NZDUSD Short term Elliott Wave view suggests the decline from 9/20 peak remains in progress a zigzag Elliott Wave structure. Down from 9/20 high (0.7434), pair ended Minor wave A at 0.7165. Subdivision of Minor wave A unfolded as 5 waves impulse where Minute wave ((i)) of A ended at 0.7276 and bounce to 0.7362 ended Minute wave ((ii)) of A. Afterwards, decline to 0.7166 ended Minute wave ((iii)) of A and Minute wave ((iv)) of A ended at 0.7239. Minute wave ((v)) of A completed at 0.7165. Pair then bounced in Minor wave B in 3 waves and ended at 0.7243. Minor wave C is currently in progress and unfolding also as 5 waves impulse. Minute wave ((i)) ended at 0.7145, Minor wave ((ii)) ended at 0.7206, and Minute wave ((iii)) at 0.7049. While Minute wave ((iv)) bounce stays below 9/29 peak (0.7243), expect pair to extend lower towards 0.6919 – 0.6983 before ending cycle from 9/20 peak.

NZDUSD 1 Hour Elliott Wave Chart
Ayoub Ben Rejeb غير متواجد حالياً  
رد مع اقتباس
عضو نشيط
 
تاريخ التسجيل: Dec 2013
الدولة: Tunisia
المشاركات: 282
خبرة السوق: أكثر من 5 سنوات
معدل تقييم المستوى: 13
Ayoub Ben Rejeb is on a distinguished road
افتراضي رد: Elliott Wave Analysis by EWF
195#
11 - 10 - 2017, 03:03 PM
FTSE Elliott Wave Analysis 10.11.2017

FTSE Short term Elliott Wave analysis suggests the decline to 7196.58 on 9/15 low ended Primary wave ((4)). The Index is currently within Primary wave ((5)) which is subdivided as a zigzag Elliott Wave structure. The first leg Intermediate wave (A) of this zigzag is in progress as 5 waves impulse where Minor wave 1 ended at 7327.50 and Minor wave 2 ended at 7289.75. Up from there, Minor wave 3 ended at 7527.59 and Minor wave 4 ended at 7493.68. The Index has broken above Minor wave 3 at 7527.59, suggesting that it’s in the final Minor wave 5 higher which should also complete Intermediate wave (A).

Cycle from 9/15 low is mature and Intermediate wave (A) could end soon. Once Intermediate wave (A) is complete, Index should pullback in Intermediate wave (B) in 3, 7, or 11 swing to correct cycle from 9/15 low (7196.58) before the rally resumes. We do not like selling the proposed pullback. As far as pivot at 9/15 low stays intact in the Intermediate wave (B) pullback later, expect Index to extend to a new high.

FTSE 1 Hour Elliott Wave Chart
Ayoub Ben Rejeb غير متواجد حالياً  
رد مع اقتباس
عضو نشيط
 
تاريخ التسجيل: Dec 2013
الدولة: Tunisia
المشاركات: 282
خبرة السوق: أكثر من 5 سنوات
معدل تقييم المستوى: 13
Ayoub Ben Rejeb is on a distinguished road
افتراضي رد: Elliott Wave Analysis by EWF
196#
12 - 10 - 2017, 05:25 PM
Trading Edge through Swings Sequences

Most Elliott Wave Practitioners think that 5 wave move off a high / low provides them with a Trading Edge as according to Elliott Wave Theory, a 5 wave move should be followed by 3 waves back and another 5 wave move in the direction of the first 5 wave move. Experience has taught us that many a times, 5 wave moves can turn out to be part of an Elliott Wave FLAT which is a 3-3-5 structure and if so, representing the end of a corrective cycle rather than start of a new cycle and hence setting a trap for the traders. Therefore, we at Elliottwave-Forecast rely more on Swing Sequences than 5 wave moves to look for our “Trading Edge”.

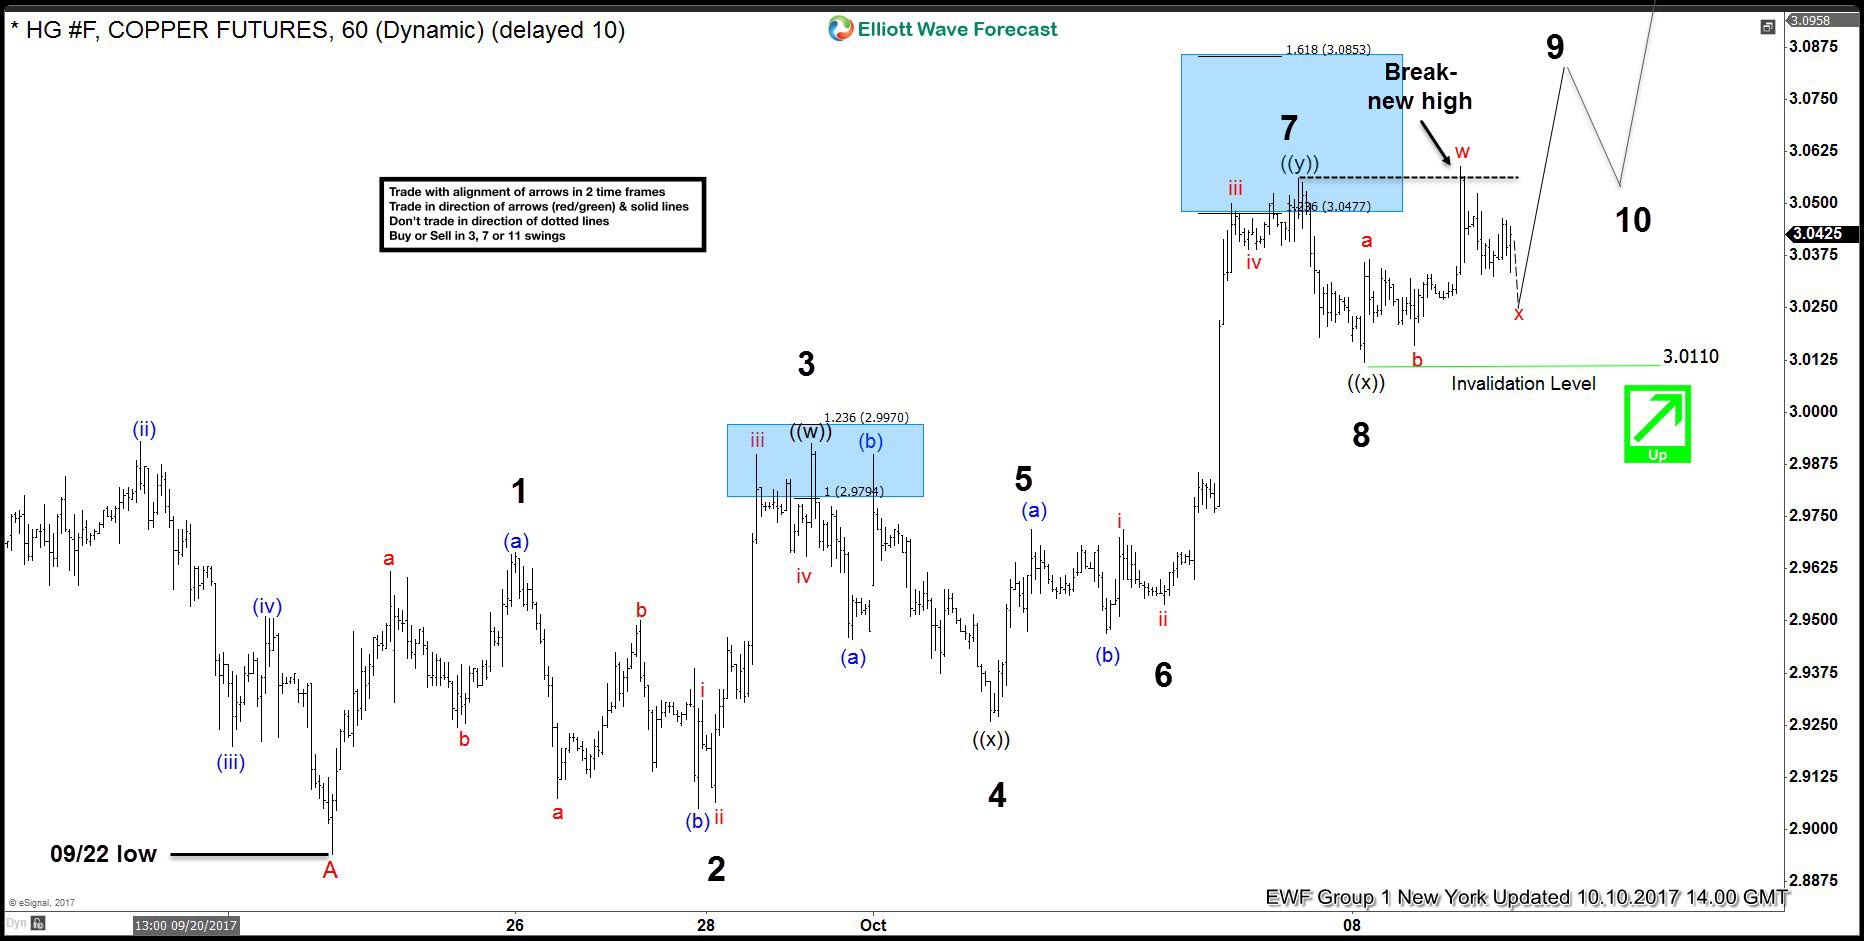
Markets move in either Impulsive Sequences or Corrective Sequences. 5,9,13,17 and so on is an impulsive sequence whereas 3,7,11,15 and so on is a corrective sequence. We believe every Elliott wave practitioner in particular and trader in general should understand the swing sequences to get a better accuracy in their forecasts and avoid getting into traps which are often laid out by the market. As we know that 7 is a corrective sequence so if we see 5 swings up with biggest correction in the middle (which is too big to be wave 4 of an impulse), then we know the sequence is incomplete and it presents a “Trading Edge” to buy the 6th swing pull back to trade the 7th swing higher. Below, we will present an example of EURAUD forex pair showing 5 swings sequence up from 7/19 (1.4418) low suggesting the sequence is bullish against 9/20 (1.4785) low and 6th swing pull back should represent a buy opportunity in 3, 7 or 11 swings with a target of 1.5543 – 1.5722 area.

EURAUD 5 swings sequence provides a “Trading Edge”


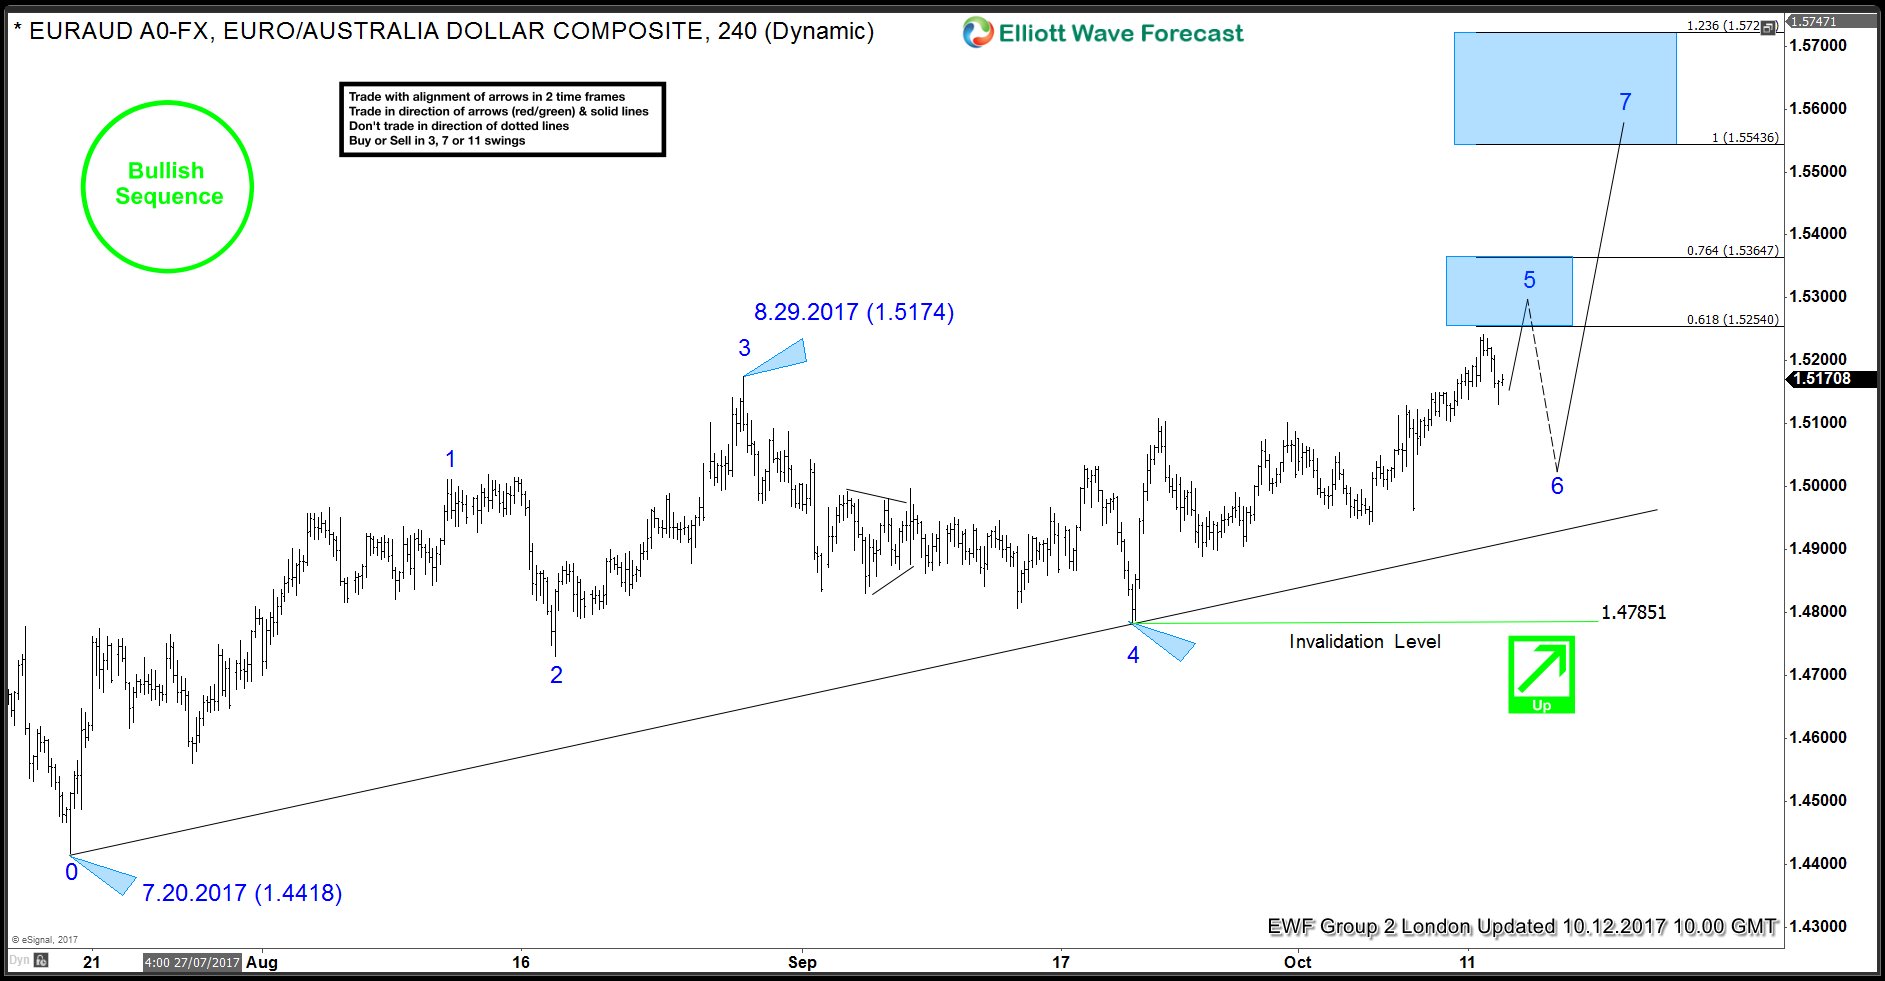
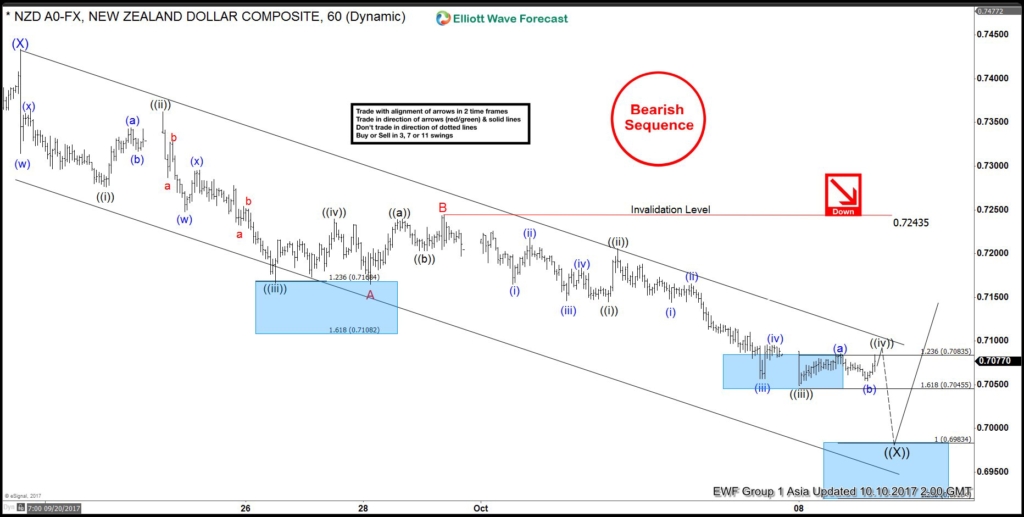
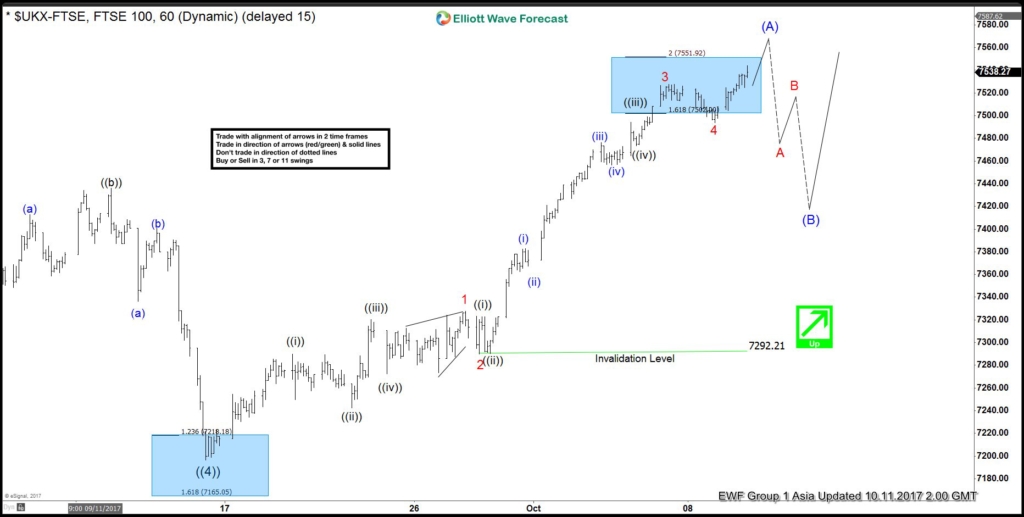
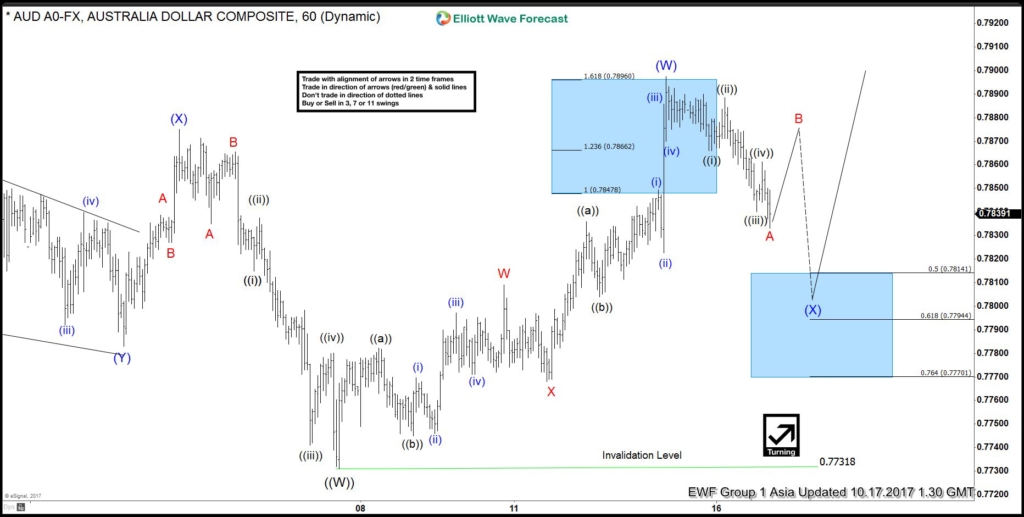
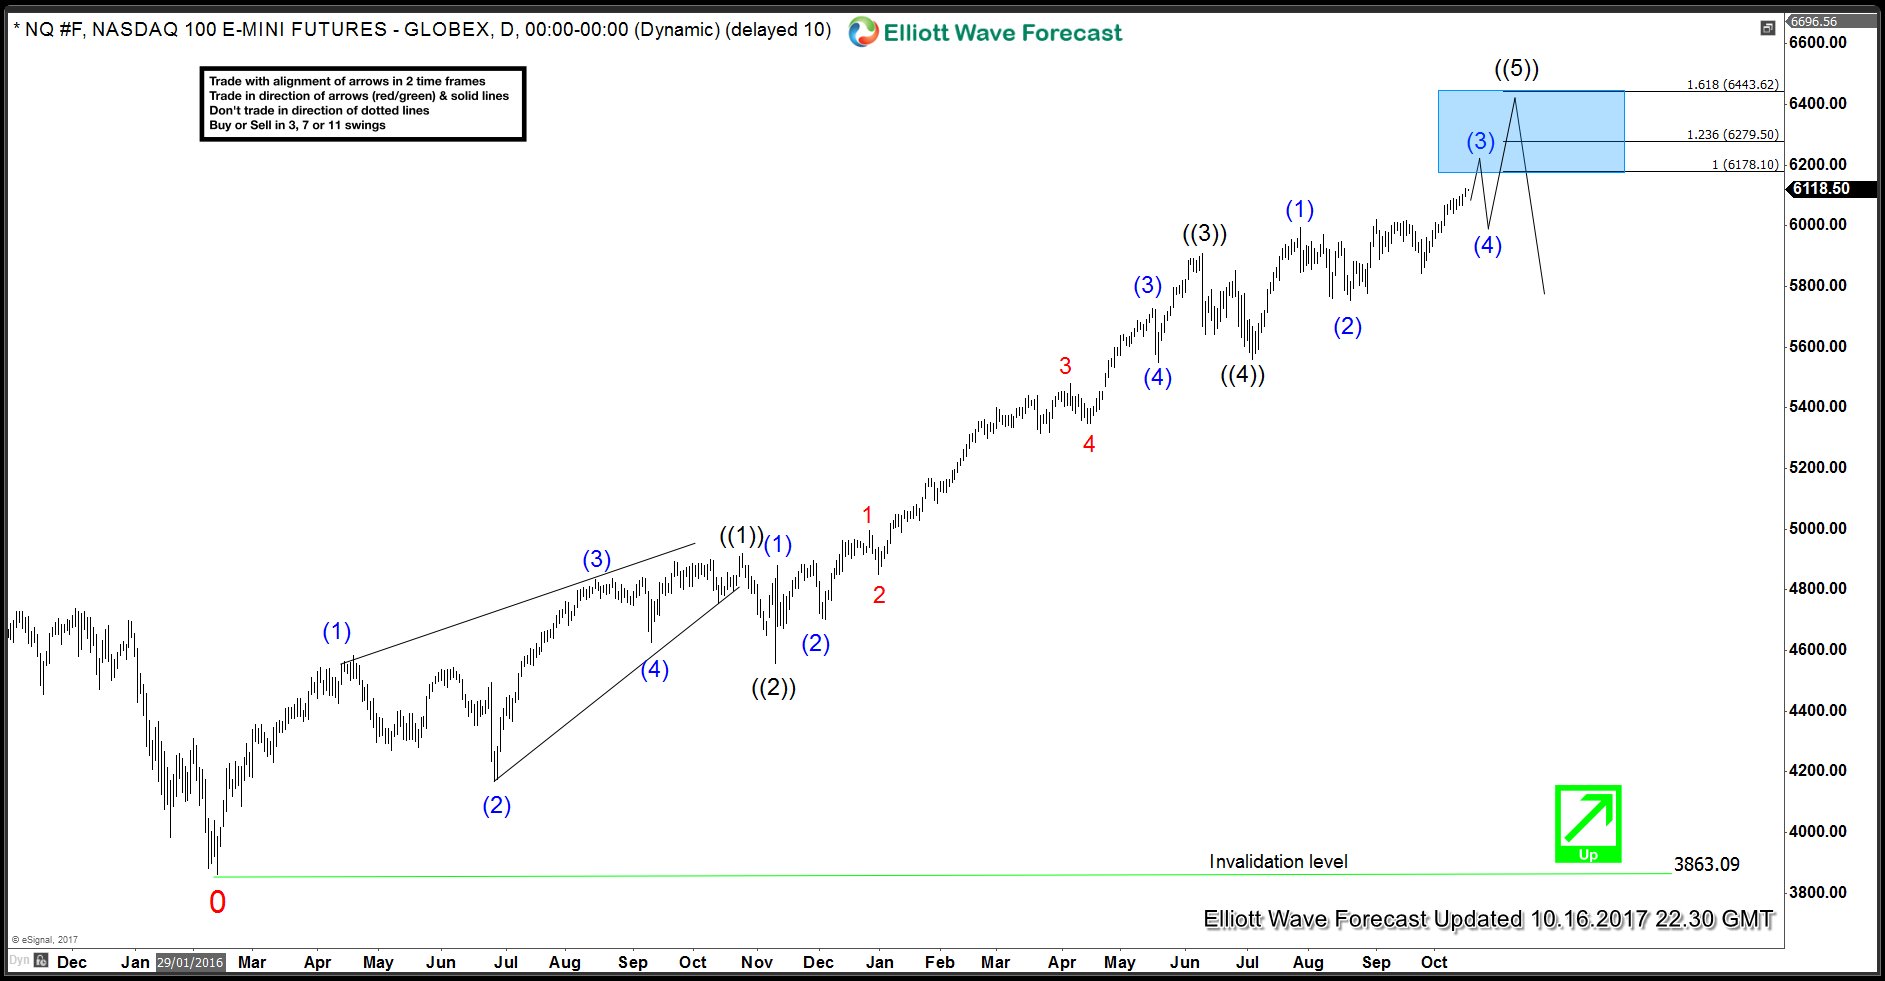
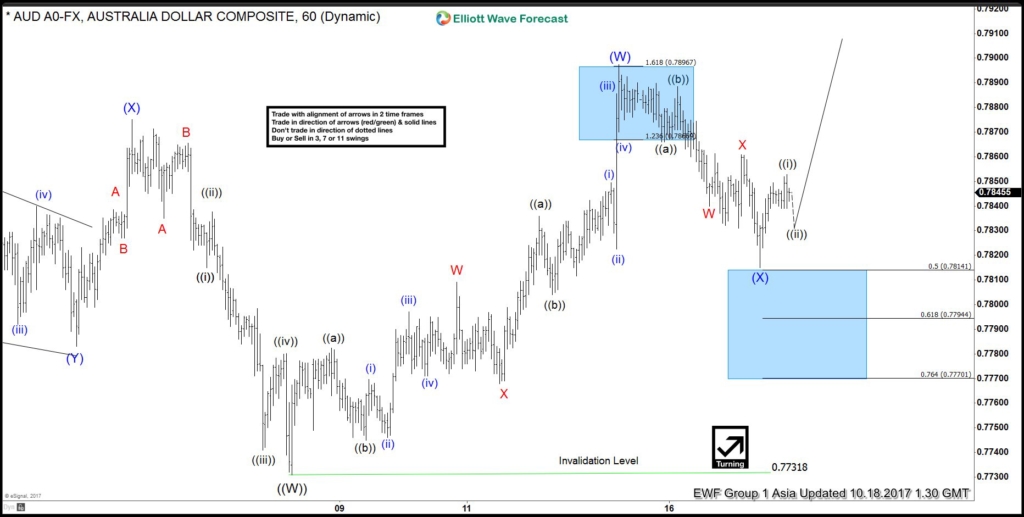
We understand that not all traders are able to identify these incomplete sequences which provide a “Trading Edge” to traders, so when ever we spot an Incomplete swings sequence on our charts, we put a Bullish Sequence or Bearish Sequence stamp on the chart for our clients to know they should be looking to buy or sell that particular instrument in 3, 7 or 11 swings. Not every instrument has a Bullish or Bearish sequence all the time but we cover 78 instruments in total so there are always some showing Bullish or Bearish swings sequence in different time frames.
Ayoub Ben Rejeb غير متواجد حالياً  
رد مع اقتباس
عضو نشيط
 
تاريخ التسجيل: Dec 2013
الدولة: Tunisia
المشاركات: 282
خبرة السوق: أكثر من 5 سنوات
معدل تقييم المستوى: 13
Ayoub Ben Rejeb is on a distinguished road
افتراضي رد: Elliott Wave Analysis by EWF
197#
17 - 10 - 2017, 02:47 PM
AUDUSD Short Term Elliott Wave Analysis 10.17

AUDUSD Short term Elliott Wave analysis suggests decline to 0.7731 ended Primary wave ((W)) on 10/6 low. Bounce in Primary wave ((X)) is proposed to be unfolding as a double three Elliott Wave structure. Intermediate wave (W) of ((X)) ended at 0.7897 and Intermediate wave (X) of ((X)) pullback is in progress as a zigzag Elliott Wave structure. Down from 0.7897 high, Minor wave A is proposed complete at 0.7832. While Minor wave B bounce stays below 0.7897, pair should turn lower in Minor wave C of (X) to correct cycle from 10/6 low. Afterwards, as far as pivot at 10/6 low (0.7731) stays intact, expect pair to resume higher.

AUDUSD 1 Hour Elliott Wave Chart
Ayoub Ben Rejeb غير متواجد حالياً  
رد مع اقتباس
عضو نشيط
 
تاريخ التسجيل: Dec 2013
الدولة: Tunisia
المشاركات: 282
خبرة السوق: أكثر من 5 سنوات
معدل تقييم المستوى: 13
Ayoub Ben Rejeb is on a distinguished road
افتراضي رد: Elliott Wave Analysis by EWF
198#
17 - 10 - 2017, 09:09 PM
NASDAQ Futures: Impulsive Rally

NASDAQ Futures rally from 2.11.2016 low is unfolding as an Elliott Wave Impulse as we can clearly see three channels in price and momentum (RSI) to support this idea. Wave ((1)) ended at 4919.50 as a diagonal, wave ((2)) ended at 4558.50,wave ((3)) completed at 5907.50 and dip to 5560 completed wave ((4)) on 7.5.2017. Up from there, so far we can only see three swings up and as wave ((5)) can’t be in 3 swings, we expect to see more upside in NASDAQ Futures to complete wave ((5)) which should also end the cycle from 2.11.2016 low. Near-term focus is on 6178 – 6279 area to complete wave (3) of ((5)) before we get a pull back in wave (4) to correct the cycle from 8.21.2017 (5752) low and higher again towards 6443 – 6604 area to complete wave ((5)).

Wave (3) of diagonal wave ((5)) is proposed to be unfolding as a double three WXY structure where wave W ended at 6019.75 and wave X ended at 5842. Index has already reached 100% extension of W-X at 6108 but has not yet reached 100% extension up from red X low so while dips stay above 10.10.2017 (6039), expect NADSAQ Futures to extend higher towards 6178 – 6279 area to complete wave (3). Break below 10.10.2017 (6039) low would suggest cycle from 5842 low ended and would favor the view that wave (3) also ended and NASDAQ Futures are already in wave (4) pull back to correct the cycle from 8.21.2017 low. Index has already reached 100% extension of W-X so we don’t like chasing strength here and don’t even like selling the Index. We see wave (4) dips when seen to offer the next ideal buying opportunity in 3, 7 or 11 swings.

NASDAQ Futures Daily Chart
Ayoub Ben Rejeb غير متواجد حالياً  
رد مع اقتباس
عضو نشيط
 
تاريخ التسجيل: Dec 2013
الدولة: Tunisia
المشاركات: 282
خبرة السوق: أكثر من 5 سنوات
معدل تقييم المستوى: 13
Ayoub Ben Rejeb is on a distinguished road
افتراضي رد: Elliott Wave Analysis by EWF
199#
18 - 10 - 2017, 01:40 PM
AUDUSD Elliott Wave Analysis 10.18

AUDUSD Elliott Wave structure suggests that the decline to 0.7731 on October 6th low ended Primary wave ((W)). From there, Primary wave ((X)) bounce is unfolding as a double three Elliott Wave structure. Rally to 0.7807 ended Intermediate wave (W) of ((X)) and pullback to 0.7815 ended Intermediate wave (X) of ((X)). A break above Intermediate wave (W) at 0.7815 will give more validity to this view. Until then, a double correction in Intermediate wave ((X)) is still possible. Near term, while pullbacks stay above 0.7815, but more importantly above 10/6 low at 0.7731, expect pair to extend higher.

AUDUSD 1 Hour Elliott Wave Chart
Ayoub Ben Rejeb غير متواجد حالياً  
رد مع اقتباس
عضو نشيط
 
تاريخ التسجيل: Dec 2013
الدولة: Tunisia
المشاركات: 282
خبرة السوق: أكثر من 5 سنوات
معدل تقييم المستوى: 13
Ayoub Ben Rejeb is on a distinguished road
افتراضي رد: Elliott Wave Analysis by EWF
200#
18 - 10 - 2017, 02:20 PM
Copper swings sequences calling the rally

Hello fellow traders. In this technical blog we’re going to take a quick look at the past Elliott Wave charts of Copper published in members area of elliottwave-forecast. In further text we’re going to count the swings, explain the short term Elliott Wave view.

Copper Elliott Wave 1 Hour Chart 10.10.2017


As our members know, Copper has had incomplete bullish sequences in larger time frames targeting 3.363 area. Consequently, we advised members to avoid selling and keep buying the dips in 3,7,11 swings. On 9th October Copper has made new short term high that made sequences bullish in the short term cycle as well. With new high we assumed that 9th swing is in progress. That means short term cycle from the 09/22 low is also having incomplete sequences . As of right now, 11th swings up are required to complete proposed cycle.
We’re labeling proposed cycle as a Triple Three structure. Second ((x)) connector is counted completed at 3.011 low and we’re about to complete short term x red pull back. As far as the mentioned level holds, we expect further rally.


Shortly after Copper found buyers , and make further separation from the 3.011 low, eventually breaking above 09/04 peak. Keep in mind market is very dynamic. If you’re interested in new Elliott Wave forecasts of Copper you can find them in the membership area of EWF.
Ayoub Ben Rejeb غير متواجد حالياً  
رد مع اقتباس


إضافة رد

الكلمات الدلالية (Tags)
commodity, elliott wave, forex, stocks


جديد مواضيع منتدى تداول العملات العام

المواضيع المتشابهه
الموضوع كاتب الموضوع المنتدى مشاركات آخر مشاركة
elliott wave Nnana123 منتدى تداول العملات العام 6 11 - 04 - 2015 07:07 PM


11:30 AM