• 12:19 مساءاً


Elliott Wave Analysis by EWF

إضافة رد
Like Tree17Likes

أدوات الموضوع
عضو فـعّـال
 
تاريخ التسجيل: Dec 2014
الدولة: بلاد العرب.
المشاركات: 1,546
خبرة السوق: أقل من 6 شهور
معدل تقييم المستوى: 13
عبد الله باسل is on a distinguished road
افتراضي رد: Elliott Wave Analysis by EWF
221#
26 - 01 - 2018, 01:27 PM
بالتوفيق اخي- سصفتىبيغفترس بالأنجليزي

التوقيع

سبحان الله والحمد لله ولااله الا الله والله أكبر
عبد الله باسل غير متواجد حالياً  
رد مع اقتباس

عضو نشيط
 
تاريخ التسجيل: Dec 2013
الدولة: Tunisia
المشاركات: 282
خبرة السوق: أكثر من 5 سنوات
معدل تقييم المستوى: 13
Ayoub Ben Rejeb is on a distinguished road
افتراضي رد: Elliott Wave Analysis by EWF
222#
08 - 02 - 2018, 01:32 PM
Elliott Wave Analysis: DXY extended correction as triple three

DXY Short Term Elliott Wave view suggests that the decline to 88.44 ended Intermediate wave (3). Up from there, correction in Intermediate wave (4) is in progress as a triple three Elliott Wave structure. Rally to 89.64 ended Minor wave W, decline to 88.55 ended Minor wave X, Minor wave Y ended at 90.03 and Minor second wave X ended at 89.48. Near term, while pullbacks stay above 89.48, Index has scope to extend higher to 90.67 – 90.95 area to end wave Z of (4) before the decline resumes. We don’t like buying the Index and expect sellers to appear from the above area for a 3 waves pullback at least

DXY 1 Hour Elliott Wave Chart
Ayoub Ben Rejeb غير متواجد حالياً  
رد مع اقتباس
عضو نشيط
 
تاريخ التسجيل: Dec 2013
الدولة: Tunisia
المشاركات: 282
خبرة السوق: أكثر من 5 سنوات
معدل تقييم المستوى: 13
Ayoub Ben Rejeb is on a distinguished road
افتراضي رد: Elliott Wave Analysis by EWF
223#
13 - 02 - 2018, 02:45 PM
Elliott Wave Analysis: Calling the low in place in Bitcoin

Bitcoin ticker symbol: ( BTCUSD ) Short Term Elliott Wave view suggests that the decline from December 17.2017 peak to February 05.2018 low (5920.72) ended the Super Cycle wave “(b)” lower. Above from there, the rally is unfolding as a leading diagonal Elliott Wave structure. Where Intermediate wave (1) ended at 9090.8 high as Elliott Wave Double three structure. Where internals of Intermediate wave (1) ended in Minor wave W at 8648.9 high and Minor wave X at 7543.3 low.

Below from 9090.8 high, the pair ended it’s short-term correction against 2/05 cycle in Intermediate wave (2) low at yesterday’s low 7820. The internals of Intermediate wave (2) unfolded as Elliott Wave Zigzag correction, where Minor wave A ended at 8170.9 and Minor wave B ended at 8589.1 high. Above from there, the pair is expected to resume the upside. However, a break of 9090.8 high remains to be seen to avoid the double correction lower in Intermediate wave (2) dip. Up from 9090.8 low, the rally is unfolding as Zigzag Elliott wave structure. Where Minute wave ((a)) ended in 5 waves at 8992.9 high, below from there, the pair is doing a short-term correction against 7820 low in 3, 7 or 11 swings within Minute wave ((b)) dip. Near-term, while dips remain above 7820 low and more importantly the pivot from 5920.72 low remains intact during the dips pair is expected to resume higher. We don’t like selling it into a proposed pullback.

BTCUSD 1 Hour Elliott Wave Chart
Ayoub Ben Rejeb غير متواجد حالياً  
رد مع اقتباس
عضو نشيط
 
تاريخ التسجيل: Dec 2013
الدولة: Tunisia
المشاركات: 282
خبرة السوق: أكثر من 5 سنوات
معدل تقييم المستوى: 13
Ayoub Ben Rejeb is on a distinguished road
افتراضي رد: Elliott Wave Analysis by EWF
224#
14 - 02 - 2018, 02:45 PM
Elliott wave Analysis: USDJPY calling for more downside

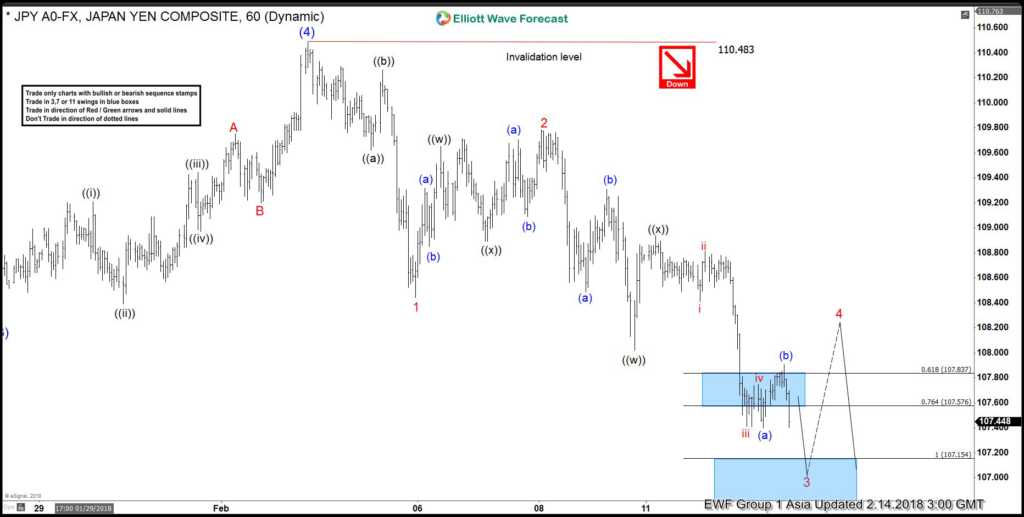
USDJPY Short-term Elliott Wave view suggests that the rally to 110.48 high ended Intermediate wave (4) bounce on February 02.2018 peak. Below from there, the decline is unfolding as an Ending Diagonal Structure within Intermediate wave (5) lower. Where Minor wave 1 ended at 108.44 low as Zigzag structure, Minor wave 2 bounce ended at 109.77 in a Double three correction. Currently, Minor wave 3 remain in progress in a Double three correction, where internals of each leg is unfolding as Elliott Wave Zigzag pattern.

Where Minutte wave ((w)) ended at 108.03 low, Minute wave ((x)) ended at 108.87. Below from there Minute ((y)) of wave 3 remains in progress as zigzag structure. When Minutte wave (a) ended in 5 waves at 107.39 low and Minutte wave (b) ended at 107.89. Near-term cycle from 2/08 high (109.77) is mature already in Minor wave 3 lower after reaching blue box area (as shown on Chart). And pair can now start the Minor wave 4 bounce anytime soon in 3, 7 or 11 swings. However within the shorter-term cycles pair could extend lower towards 106.39-105.47 100%-161.8% Fibonacci extension area of (a)-(b) within ((y)) of 3 lower before a bounce in Minor wave 4 takes place. We don’t like buying the pair and as far as a pivot from 2/08 high 109.77 holds the wave 4 bounce should get rejected in 3, 7 or 11 swings for further downside extension in Minor 5 of (5) lower.

USDJPY 1 Hour Elliott Wave Chart
Ayoub Ben Rejeb غير متواجد حالياً  
رد مع اقتباس
عضو نشيط
 
تاريخ التسجيل: Dec 2013
الدولة: Tunisia
المشاركات: 282
خبرة السوق: أكثر من 5 سنوات
معدل تقييم المستوى: 13
Ayoub Ben Rejeb is on a distinguished road
افتراضي رد: Elliott Wave Analysis by EWF
225#
20 - 02 - 2018, 03:29 PM
Elliott Wave Analysis: Gold Favored Higher Against 1306.96

Gold Short Term Elliott Wave view suggests that Intermediate wave (X) ended with the decline to 1306.96. Up from there, the yellow metal is rallying in 5 waves impulse Elliott Wave structure where Minutte wave (i) ended at 1337, Minutte wave (ii) ended at 1317.27, Minutte wave (iii) ended at 1357.12, Minutte wave (iv) ended at 1348.30, and Minutte wave (v) ended at 1361.72.

The 5 waves rally from 1306.96 to 1361.72 ended a higher degree Minute wave ((a)) of a zigzag Elliott Wave Structure. Minute wave ((b)) is currently in progress to correct cycle from 2/8 low in 3, 7, or 11 swing. The next extreme area in 7 swing comes at 1330.07 – 1334.15 where Minute wave ((b)) can end. Afterwards, as far as pivot at 2/8 low (1306.96) stays intact, expect Gold to extend higher. We don’t like selling Gold and expect buyers to appear at 1330.07 – 1334.15 area for a 3 waves bounce at least.

Gold 1 Hour Elliott Wave Chart
Ayoub Ben Rejeb غير متواجد حالياً  
رد مع اقتباس
عضو نشيط
 
تاريخ التسجيل: Dec 2013
الدولة: Tunisia
المشاركات: 282
خبرة السوق: أكثر من 5 سنوات
معدل تقييم المستوى: 13
Ayoub Ben Rejeb is on a distinguished road
افتراضي رد: Elliott Wave Analysis by EWF
226#
21 - 02 - 2018, 01:58 PM
Elliott Wave Analysis: Gold Ending Correction

Gold Short Term Elliott Wave view suggests that the decline to 1306.96 ended Intermediate wave (X). The rally from there is unfolding in 5 waves impulse Elliott Wave structure. Minutte wave (i) ended at 1337, Minutte wave (ii) ended at 1317.27, Minutte wave (iii) ended at 1357.12, Minutte wave (iv) ended at 1348.30, and Minutte wave (v) ended at 1361.72.

The 5 waves rally also ended a higher degree Minute wave ((a)) of a zigzag Elliott Wave Structure. Minute wave ((b)) pullback is currently in progress to correct cycle from 2/8 low in 3, 7, or 11 swing. Minute wave ((b)) has reached 1323.39 – 1334.07 area where it could end. As far as pivot at 2/8 low (1306.96) stays intact, expect Gold to extend higher. We don’t like selling the yellow metal and expect buyers to appear at 1330.07 – 1334.15 area for a 3 waves bounce at least.

If pivot at 2/8 low (1306.96) fails, then Gold is doing a double correction in Intermediate wave (X). In this case, the yellow metal then can extend lower to 1289.48 – 1303.34 area where wave (X) can end and the rally resumes.

Gold 1 Hour Elliott Wave Chart
Ayoub Ben Rejeb غير متواجد حالياً  
رد مع اقتباس
عضو نشيط
 
تاريخ التسجيل: Dec 2013
الدولة: Tunisia
المشاركات: 282
خبرة السوق: أكثر من 5 سنوات
معدل تقييم المستوى: 13
Ayoub Ben Rejeb is on a distinguished road
افتراضي رد: Elliott Wave Analysis by EWF
227#
22 - 02 - 2018, 03:18 PM
Elliott Wave Analysis: Gold Can do a Double Correction

Gold Short Term Elliott Wave view suggests that the yellow metal is still correcting cycle from 12.13.2017 low ($1236.30) as a double three Elliott Wave structure. Down from 1.25.2018 high ($1366.06), the decline is unfolding as a double three where Minor wave W ended at $1306.96 and Minor wave X bounce ended at $1361.81.

Minor wave Y is in progress and the subdivision is also unfolding as a double there where Minute wave ((w)) ended at $1324.75 and Minute wave ((x)) ended at $1336.21. Near term, while bounces stay below $1336.21, but more importantly below $1361.81, the yellow metal has scope to extend lower towards $1288.27 – $1302.28 to end Minor wave Y. Afterwards, expect Gold to resume the rally higher or at least bounce in larger 3 waves to correct cycle from 1.25.2018 high. We don’t like selling the proposed pullback

For this view to be gain more validity, Gold needs to break below Minor wave W at $1306.96. Until then, there is no guarantee Gold will extend lower and the right side remains higher as the yellow metal still has 5 swing bullish sequence from 12.15.2016 low. We do not like selling the proposed pullback and expect buyers to appear at $1228.27 – $1302.28 (if reached) for a 3 waves bounce at least.

Gold 1 Hour Elliott Wave Chart
Ayoub Ben Rejeb غير متواجد حالياً  
رد مع اقتباس
عضو نشيط
 
تاريخ التسجيل: Dec 2013
الدولة: Tunisia
المشاركات: 282
خبرة السوق: أكثر من 5 سنوات
معدل تقييم المستوى: 13
Ayoub Ben Rejeb is on a distinguished road
افتراضي رد: Elliott Wave Analysis by EWF
228#
23 - 02 - 2018, 04:12 PM
Elliott Wave Analysis: Gold Ended Correction

We revise our Gold Short Term Elliott Wave view to a more aggressive one and call the decline to 2.8.2018 at $1306.8 ending Intermediate wave (X). For this view to get validity however, the yellow metal needs to break above Intermediate wave (W) at $1366.06. Until then, the alternate view can’t be ruled out that the yellow metal can do a double correction in Intermediate wave (X) towards $1228.27 – $1302.28 before the rally resumes.

Up from $1306.8, the rally is proposed to be unfolding as a zigzag Elliott Wave structure where Minute wave ((a)) ended at $1361.72 and Minute wave ((b)) is proposed complete at $1320.60. Near term, while pullbacks stay above there, and more importantly above $1306.8, expect Gold to extend higher. We don’t like selling the yellow metal. If Gold breaks below $1306.8, then the yellow metal is doing a double correction in Intermediate wave (X) and opens extension lower towards $1228.27 – $1302.28 where buyers should appear for at least a 3 waves bounce.

Gold 1 Hour Elliott Wave Chart
Ayoub Ben Rejeb غير متواجد حالياً  
رد مع اقتباس
عضو نشيط
 
تاريخ التسجيل: Dec 2013
الدولة: Tunisia
المشاركات: 282
خبرة السوق: أكثر من 5 سنوات
معدل تقييم المستوى: 13
Ayoub Ben Rejeb is on a distinguished road
افتراضي رد: Elliott Wave Analysis by EWF
229#
27 - 02 - 2018, 01:42 PM
Gold Elliott Wave Analysis: 2.27.2018

Short Term Elliott Wave view in Gold suggests the decline to $1306.8 ended Intermediate wave (X). However, the yellow metal needs to break above Intermediate wave (W) at $1366.06 to rule out the possibility of a double correction in wave (X). Up from $1306.8, the rally is proposed to be unfolding as a double three Elliott Wave structure where Minute wave (w))) ended at $1357.12 and Minute wave ((x)) is proposed complete at $1320.60. Near term, while pullbacks stay above there, and more importantly above $1306.8, expect the yellow metal to extend higher. We don’t like selling the yellow metal. If Gold breaks below $1306.8, then Intermediate wave (X) is unfolding as a double correction and opens extension lower towards $1228.27 – $1302.28 where buyers should appear for at least a 3 waves bounce.

Gold 1 Hour Elliott Wave Chart
Ayoub Ben Rejeb غير متواجد حالياً  
رد مع اقتباس
عضو نشيط
 
تاريخ التسجيل: Dec 2013
الدولة: Tunisia
المشاركات: 282
خبرة السوق: أكثر من 5 سنوات
معدل تقييم المستوى: 13
Ayoub Ben Rejeb is on a distinguished road
افتراضي رد: Elliott Wave Analysis by EWF
230#
01 - 03 - 2018, 02:16 PM
Elliott Wave Analysis: Gold in Double Correction

Revised Short Term Elliott Wave view in Gold suggests that the yellow metal is still correcting cycle from 12/13/2017 low ($1236.3) as a double three Elliott Wave structure. Up from 12/13/2017 low, Intermediate wave (W) ended at $1366.06 and Intermediate wave (X) pullback remains in progress as a double three.

Down from $1366.06, Wave W of (X) ended at $1306.80 and wave X of (X) ended at $1357.12. Near term, while bounces stay below $1361.4, expect Gold to extend lower in wave Y of (X) towards $1288.1 – $1302.11 before the rally resumes. We don’t like selling the yellow metal and expect buyers to appear from the above area for at least a 3 waves bounce if not an extension to new high.

Gold 1 Hour Elliott Wave Chart
Ayoub Ben Rejeb غير متواجد حالياً  
رد مع اقتباس


إضافة رد

الكلمات الدلالية (Tags)
commodity, elliott wave, forex, stocks


جديد مواضيع منتدى تداول العملات العام

المواضيع المتشابهه
الموضوع كاتب الموضوع المنتدى مشاركات آخر مشاركة
elliott wave Nnana123 منتدى تداول العملات العام 6 11 - 04 - 2015 07:07 PM


12:19 PM