• 12:19 مساءاً


Elliott Wave Analysis by EWF

إضافة رد
Like Tree17Likes

أدوات الموضوع
عضو نشيط
 
تاريخ التسجيل: Dec 2013
الدولة: Tunisia
المشاركات: 282
خبرة السوق: أكثر من 5 سنوات
معدل تقييم المستوى: 13
Ayoub Ben Rejeb is on a distinguished road
افتراضي رد: Elliott Wave Analysis by EWF
241#
04 - 04 - 2018, 06:19 PM
Elliott Wave View: Copper Starts a New Leg Higher

Short Term Elliott Wave view in Copper suggests that the decline to 2.938 on 3.26.2018 ended Minor wave IV. The metal started a new leg higher from there in Minor wave V. Subdivision of Minor wave V is unfolding as an impulse Elliott Wave structure. An Impulse Elliott Wave structure is a 5 waves structure where wave 1, 3, and 5 subdivision are also internally in 5 waves (impulsive). In the case of Copper, up from 2.938, Minutte wave (i) ended at 3.024, Minutte wave (ii) ended at 2.968, Minutte wave (iii) ended at 3.072, and Minutte wave (iv) ended at 3.037.

Near term focus is on 3.081 – 3.095 to complete Minutte wave (v). This next leg higher in Minutte wave (v) should end Minute wave ((i)) of a larger degree. Copper should then pullback in Minute wave ((ii)) in 3, 7, or 11 swing to correct cycle from 3/26/2018 low before the rally resumes, provided pivot at 2.938 low stays intact. We don’t like selling the proposed pullback and expect buyers to appear while Minute wave ((ii)) dips stay above 2.938 low.

Copper Elliott Wave 1 Hour Chart
Ayoub Ben Rejeb غير متواجد حالياً  
رد مع اقتباس

الصورة الرمزية hakim sahraoui
عضو برونزي
الصورة الرمزية hakim sahraoui
 
تاريخ التسجيل: Jul 2010
الدولة: الحزائر
المشاركات: 2,852
خبرة السوق: 3 الى 5 سنوات
معدل تقييم المستوى: 18
hakim sahraoui is on a distinguished road
افتراضي رد: Elliott Wave Analysis by EWF
242#
04 - 04 - 2018, 08:48 PM
اكتب عربي اخي مانعرف انجليزي وحتي ترجمة قوقل لا تفي بالغرض
وموفق ان شاء الله

التوقيع

﴿فَقُلْتُ اسْتَغْفِرُوا رَبَّكُمْ إِنَّهُ كَانَ غَفَّارًا (10) يُرْسِلِ السَّمَاءَ عَلَيْكُمْ مِدْرَارًا (11) وَيُمْدِدْكُمْ بِأَمْوَالٍ وَبَنِينَ وَيَجْعَلْ لَكُمْ جَنَّاتٍ وَيَجْعَلْ لَكُمْ أَنْهَارًا﴾ [نوح: 10-12]،
hakim sahraoui غير متواجد حالياً  
رد مع اقتباس
عضو نشيط
 
تاريخ التسجيل: Dec 2013
الدولة: Tunisia
المشاركات: 282
خبرة السوق: أكثر من 5 سنوات
معدل تقييم المستوى: 13
Ayoub Ben Rejeb is on a distinguished road
افتراضي رد: Elliott Wave Analysis by EWF
243#
06 - 04 - 2018, 05:49 PM
Elliott Wave Analysis: Further Strength in USDJPY

USDJPY short term Elliott Wave view suggests that the decline to 104.54 low on March 26 ended Intermediate wave (3). Wave (4) correction is in progress as a double three Elliott Wave Structure. A double three is a 7 swing corrective structure with WXY label. In the case of USDJPY, minor wave W of (4) ended at 107.01 and minor wave X of (4) ended at 105.62. As near term pullback stays above there, expect pair to extend higher within wave Y of (4).

Subdivision of Minor wave W of (4) in USDJPY unfolded as a zigzag Elliott Wave structure where Minute wave ((a)) ended at 105.9, Minute wave ((b)) ended at 105.29, and Minute wave ((c)) of W ended at 107.01. Subdivision of Minor wave X of (4) also unfolded as a zigzag Elliott Wave structure where Minute wave ((a)) ended at 106.09, Minute wave ((b)) ended at 106.45, and Minute wave ((c)) of X ended at 105.62.

Minor wave Y of (4) is currently in progress as a double three Elliott Wave structure where the rally from 105.62 ended at 107.49 in Minute wave ((w)). Expect pair to pullback within Minute wave ((x)) in 3, 7, or 11 swing to correct cycle from 4/3 low before the rally resumes.

USDJPY Elliott Wave 1 Hour Chart
Ayoub Ben Rejeb غير متواجد حالياً  
رد مع اقتباس
عضو نشيط
 
تاريخ التسجيل: Dec 2013
الدولة: Tunisia
المشاركات: 282
خبرة السوق: أكثر من 5 سنوات
معدل تقييم المستوى: 13
Ayoub Ben Rejeb is on a distinguished road
افتراضي رد: Elliott Wave Analysis by EWF
244#
17 - 04 - 2018, 05:55 PM
USDCAD Elliott Wave View: Calling Intraday Bounce

USDCAD Elliott Wave short-term view suggests that the bounce to 1.2942 high ended Intermediate degree wave (2). Then the decline from there is unfolding in an impulse sequence with an internal sub-division of each leg lower is showing 5 waves structure thus favored it to be an impulse. Below from 1.2942 high, Intermediate wave (3) remains in progress in 5 waves structure looking for 1 more push lower before a bounce in Intermediate wave (4) takes place.

Now let’s take a quick look at the short-term price action in the pair from 1.2942 high. The decline from there can be seen in 5 waves impulse sequence, where Minor wave 1 of (3) ended in 5 waves at 1.2744. Minor wave 2 of (3) ended 1.2818, Minor wave 3 of (3) ended in another 5 waves at 1.2543 low. And above from there Minor wave 4 of (3) bounce ended in 3 swings as a Flat structure at 1.2622 high. Below from there, the pair is expected to see another marginal push lower towards the inverse 1.236-1.618% ext area of Minor wave 4 at 1.2524-1.2493 area approximately to end the Minor wave 5 of (3) lower. However, in case of further downside extension pair can extend in Minor wave 5 of (3) towards wave 5=1 target area as well at 1.2418-1.2373 area before a bounce in intermediate wave (4) takes place against 1.2942 high. Which should then expected to fail in 3, 7 or 11 swings against 1.2942 high for further downside extension, so don’t like buying the pair into proposed bounces.

USDCAD Elliott Wave 1 Hour Chart
Ayoub Ben Rejeb غير متواجد حالياً  
رد مع اقتباس
عضو نشيط
 
تاريخ التسجيل: Dec 2013
الدولة: Tunisia
المشاركات: 282
خبرة السوق: أكثر من 5 سنوات
معدل تقييم المستوى: 13
Ayoub Ben Rejeb is on a distinguished road
افتراضي رد: Elliott Wave Analysis by EWF
245#
19 - 04 - 2018, 05:38 PM
CL_F Elliott Wave short-term view suggests that the decline to 61.80 on 4/06/2018 low ended Intermediate wave (2). Above from there, Intermediate wave (3) remains in progress as Zigzag Elliott Wave structure. Looking to extend higher towards 70.43-72.47 area at a minimum. Up from 61.80 low, the instrument made a strong rally higher. And ended Minor wave A at 67.45 high in 5 waves structure.

The internals of Minor wave A unfolded in 5 waves impulse Elliott Wave structure where Minute wave ((i)) at 62.43, Minute wave ((ii)) ended at 62.09. Minute wave ((iii)) ended at 66.44 and Minute wave ((iv)) ended at 65.71 low. And Minute wave ((v)) of A ended at 67.45. The instrument then made a 3 waves correction lower in Minor wave B pullback as a Flat. Down from 67.45, Minute wave ((a)) at 66 low, Minute wave ((b)) at 67.76 and Minute wave ((c)) of B ended at 65.56 low.

Above from there, the instrument already broke to new highs confirming the next extension higher in Minor wave C of (3). Therefore looking for the extension higher towards 70.43-72.47 as noted above. Up from 65.56 low, the instrument is expected to end 5 waves in Minute wave ((i)) of C soon. And should see a pullback in Minute wave ((ii)) of C in 3, 7 or 11 swings before further upside is seen. We don’t like selling it.

CL_F Elliott Wave 1 Hour Chart
Ayoub Ben Rejeb غير متواجد حالياً  
رد مع اقتباس
عضو نشيط
 
تاريخ التسجيل: Dec 2013
الدولة: Tunisia
المشاركات: 282
خبرة السوق: أكثر من 5 سنوات
معدل تقييم المستوى: 13
Ayoub Ben Rejeb is on a distinguished road
افتراضي رد: Elliott Wave Analysis by EWF
246#
20 - 04 - 2018, 05:56 PM
EURUSD Elliott Wave View: Still Trading Sideways

Short-term EURUSD Elliott Wave view suggests that the pair remains in a sideways triangle range between 1.2554 and 1.2153 levels as mentioned in the previous post here. Until we break out of the range, we look for the sideways price action to continue. Triangle doesn’t have any particular trend, but it is generally a continuation pattern, thus the pair likely thrust higher to continue the previous bullish trend after the sideways action is over. If we take a look at the previous cycle from January 2017 low. The pair shows a higher high sequence thus the pair is favored to trade higher once triangle consolidation is complete. It’s important to note that the Triangle is labeled as A,B,C,D,E.

Currently, we can be in the final stage of triangle structure in Cycle degree wave IV where the decline to 1.2214 low ended Primary wave ((C)) of IV. Above from there, wave ((D)) of IV ended at 1.2414 high. The internals of primary wave ((D)) is unfolding as zigzag Elliott Wave structure where Intermediate wave (A) ended at 1.2396. Afterwards, Intermediate wave (B) pullback ended at 1.2298 low and Intermediate wave (C) of ((D)) ended at 1.2414 high. Down from there, Primary wave ((E)) of IV remains in progress as double three Elliott Wave structure looking to end Intermediate wave (W) of ((E)) in 3 swings at 1.2320-1.2301 100%-123.6% Fibonacci extension area of Minor A-B. Pair should then correct in Intermediate wave (X) of ((E)) and ideally fail below 1.2414 for another extension lower before a thrust higher is seen. We don’t like selling the pair.

EURUSD Elliott Wave 1 Hour Chart
Ayoub Ben Rejeb غير متواجد حالياً  
رد مع اقتباس
عضو نشيط
 
تاريخ التسجيل: Dec 2013
الدولة: Tunisia
المشاركات: 282
خبرة السوق: أكثر من 5 سنوات
معدل تقييم المستوى: 13
Ayoub Ben Rejeb is on a distinguished road
افتراضي رد: Elliott Wave Analysis by EWF
247#
24 - 04 - 2018, 05:55 PM
USDX Elliott Wave View: Extending Higher As Impulse

USDX Elliott Wave view in short-term cycle suggests that the decline to 89.22 ended Intermediate wave (B) as Elliott Wave Zigzag correction. Above from there, Intermediate wave (C) remains in progress as Elliott Wave Impulsive sequence with extension looking for further extension higher. The internal distribution of each leg consists of 5 waves structure with extension in the third wave thus we favor the structure to be an impulsive sequence.

Up from 89.22 low, Minor wave 1 of (C) ended in 5 waves at 89.66, Minor wave 2 ended as a Flat at 89.45 low. Then above from there Minor wave 3 remains in progress. The internal of Minor wave 3 is unfolding as an Impulse Elliott Wave sequence with extension where Minute wave ((i)) ended at 89.72, Minute wave ((ii)) ended at 89.51, Minute wave ((iii)) ended at 90.47 high, and Minute wave ((iv)) ended at 90.21 low. Above from there, Minute wave ((v)) of 3 remains in progress looking to extend higher 1 more push towards 91.17 – 91.40 area approximately to end 5 waves in Minor wave 3. Afterwards, the index should do a Minor wave 4 pullback in 3, 7 or 11 swings before further upside is seen. We don’t like selling it into a proposed pullback.

USDX Elliott Wave 1 Hour Chart
Ayoub Ben Rejeb غير متواجد حالياً  
رد مع اقتباس
عضو نشيط
 
تاريخ التسجيل: Dec 2013
الدولة: Tunisia
المشاركات: 282
خبرة السوق: أكثر من 5 سنوات
معدل تقييم المستوى: 13
Ayoub Ben Rejeb is on a distinguished road
افتراضي رد: Elliott Wave Analysis by EWF
248#
01 - 05 - 2018, 06:08 PM
NZDJPY Elliott Wave View: Impulse Sequence In Progress

NZDJPY Elliott Wave view in short-term cycles suggests that the bounce to 79.62 high ended Intermediate wave (X). Down from there, Intermediate wave (Y) remains in progress as a Zigzag Elliott Wave structure in which the first leg of the zigzag (Minor wave A) is unfolding as an impulse Elliott Wave structure looking to see another push lower before ending Minor wave A.

Down from 79.62 high, Minute wave ((i)) of A ended at 78.63. Minute wave ((ii)) of A ended at 79.06. Minute wave ((iii)) of A ended at 76.91 and Minute wave ((iv)) of A ended at 77.4 high. As an impulse, the subdivision of Minute wave ((i)), ((iii)), and ((v)) in Minor wave A has an internal distribution of smaller degree 5 waves. Minute wave ((v)) of A remains in progress as 5 waves structure towards 76.78-76.58, which is inverse 1.236-1.618% Fibonacci extension area of a Minute wave ((iv)).

Afterward, the pair can complete Minor wave A and end cycle from 4/13 peak, then it should bounce in Minor wave B to correct cycle from 4/13 high (79.62) in 3, 7 or 11 swings. As far as Minor wave B rally fails below 79.62 high, the pair should resume lower again in Minor wave C of (Y). We don’t like buying the proposed rally.

NZDJPY Elliott Wave 1 Hour Chart
Ayoub Ben Rejeb غير متواجد حالياً  
رد مع اقتباس
عضو نشيط
 
تاريخ التسجيل: Dec 2013
الدولة: Tunisia
المشاركات: 282
خبرة السوق: أكثر من 5 سنوات
معدل تقييم المستوى: 13
Ayoub Ben Rejeb is on a distinguished road
افتراضي رد: Elliott Wave Analysis by EWF
249#
01 - 05 - 2018, 06:33 PM
$AAPL Apple Expanded Flat from the 1/18/18 highs?


Longer term on monthly and weekly charts it obviously appears that Apple remains in an uptrend. I will try to explain where the instrument can reach in the expanded flat from the 1/18/18 highs. I will also provide an alternate scenario that will offer a similar buy zone before the next leg higher. Apple’s stock made new highs in January however we think that was part of a larger correction.

With the possible expanded flat from the January 18 highs, the Elliott Wave structure would be 3-3-5. That means the leg lower from the 1/18/2018 highs to the 2/9/2018 lows was three swings and not an impulsive five waves. From the 2/9/2018 lows, the same can be said for the three swing bounce into the new highs on March 13th 2018. From those highs, this leaves the incomplete structure still needing the wave three of the impulse to complete along with a relatively shallow bounce in wave four followed with a final wave five low that would show momentum divergence compared to the wave three. The conclusion is below the chart.

$AAPL Apple Daily chart


In conclusion.

The target area for the the expanded flat is shown in the blue box on the chart and is derived from a Fibonacci extension measurement using a chart platform Fibonacci extension tool. With the beginning point being at the 1/18/2018 highs, go down to the 2/2/2018 lows as point #2. From there up to the 3/13/2018 highs being point #3. That will give the extension area shown on the chart as the potential buy zone.

Finally as I mentioned in the first paragraph an alternative structure and target area will be a simple three swings lower from the 3/13/2018 highs. That would be a double three correction which counts as 3-3-3. This target area is not shown on the chart but I will tell you how to get it. Using the charting platform Fibonacci extension tool in the same manner as before. Begin at the 3/13/2018 highs as point #1 on down to the April 2nd lows as point #2. From there point #3 will be at the April 17th highs. That gives an extension area for a double three correction at the 159.66-147.74 area.
Ayoub Ben Rejeb غير متواجد حالياً  
رد مع اقتباس
عضو نشيط
 
تاريخ التسجيل: Dec 2013
الدولة: Tunisia
المشاركات: 282
خبرة السوق: أكثر من 5 سنوات
معدل تقييم المستوى: 13
Ayoub Ben Rejeb is on a distinguished road
افتراضي رد: Elliott Wave Analysis by EWF
250#
03 - 05 - 2018, 06:53 PM
AT&T Elliott Wave View: Calling For 3 Wave Bounce

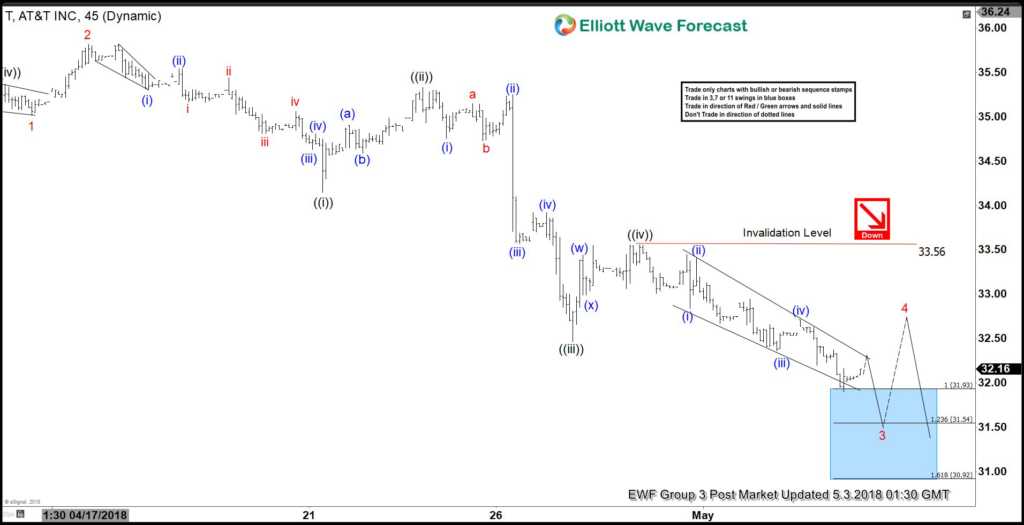
AT&T ticker symbol $T short-term Elliott Wave view suggests that the decline from 4/10 peak is unfolding as an Impulse Elliott Wave structure. In the impulsive structure, wave 1, 3, and 5 should show 5 waves internal subdivision.

Down from 4/10 peak ($36.39), Minor wave 1 ended in 5 waves structure at 35.02 low. Minor wave 2 bounce ended at 35.82 and Minor wave 3 is in progress with subdivision of 5 waves impulsive structure in the lesser degree. Down from 35.82, Minute wave ((i)) of 3 ended at 34.15, Minute wave ((ii)) of 3 ended at 35.33, Minute wave ((iii)) of 3 ended at 32.47, and Minute wave ((iv)) of 3 ended at 33.56 high.

Below from there, Minute wave ((v)) of 3 remains in progress. Minor wave 3 has reached the minimum number of swings and target, although a marginal low still can’t be ruled out towards $31.54 – $30.92. This is the 123.6%-161.8% Fibonacci extension area of ((v))=((i)). Afterwards, AT&T should end the 5 waves structure in Minor wave 3 and see a Minor wave 4 bounce in 3, 7 or 11 swings against 35.82 high before further downside resumes. We don’t like buying into the proposed bounce.

AT&T 1 Hour Elliott Wave Chart
Ayoub Ben Rejeb غير متواجد حالياً  
رد مع اقتباس


إضافة رد

الكلمات الدلالية (Tags)
commodity, elliott wave, forex, stocks


جديد مواضيع منتدى تداول العملات العام

المواضيع المتشابهه
الموضوع كاتب الموضوع المنتدى مشاركات آخر مشاركة
elliott wave Nnana123 منتدى تداول العملات العام 6 11 - 04 - 2015 07:07 PM


12:19 PM