• 12:19 مساءاً


Elliott Wave Analysis by EWF

إضافة رد
Like Tree17Likes

أدوات الموضوع
عضو نشيط
 
تاريخ التسجيل: Dec 2013
الدولة: Tunisia
المشاركات: 282
خبرة السوق: أكثر من 5 سنوات
معدل تقييم المستوى: 13
Ayoub Ben Rejeb is on a distinguished road
افتراضي رد: Elliott Wave Analysis by EWF
231#
02 - 03 - 2018, 12:19 PM
CADJPY Elliott Wave Analysis: Correction Expected Before Lower Again

Short Term CADJPY Elliott Wave view suggests that the decline from 1/5/2018 high (91.58) is unfolding as an impulse Elliott Wave Structure where Minor wave 1 ended at 87.785, Minor wave 2 ended at 89.439, Minor wave 3 ended at 84.468, and Minor wave 4 ended at 85.24. Minor wave 5 remains in progress as an impulse Elliott Wave structure where Minute wave ((a)) of 5 is expected to end soon.

Minute wave ((a)) of 5 is unfolding as an impulse Elliott Wave structure where Minutte wave (i) ended at 83.82, Minutte wave (ii) ended at 84.82, Minutte wave (iii) ended at 82.94, and Minutte wave (iv) ended at 83.65. Pair has reached the minimum target in price and swing to end Minutte wave (v) of ((a)) although another extension lower can’t be ruled out. Expect pair to bounce in Minute wave ((b)) soon to correct cycle from 2/21 peak (85.24) in 3, 7, or 11 swing before the decline resumes. We don’t like buying the proposed bounce.

CADJPY 1 Hour Elliott Wave Chart
Ayoub Ben Rejeb غير متواجد حالياً  
رد مع اقتباس

عضو نشيط
 
تاريخ التسجيل: Dec 2013
الدولة: Tunisia
المشاركات: 282
خبرة السوق: أكثر من 5 سنوات
معدل تقييم المستوى: 13
Ayoub Ben Rejeb is on a distinguished road
افتراضي رد: Elliott Wave Analysis by EWF
232#
06 - 03 - 2018, 01:07 PM
DAX Elliott wave view: Calling for another extension lower

DAX, the index from Germany, is correcting higher degree cycle from February 2016. Short-term Elliott Wave view suggests that the rally to 12597.51 at February 26.2018 ended Primary wave ((X)). Down from there, the decline unfolded as a 5 waves Elliott Wave Impulse Sequence which ended at 11730.50 and this 5 waves ended Intermediate wave (A) of a Zigzag structure in the higher degree. Zigzag structure is a 5-3-5 sequence and according to Elliott wave theory, after ending the first 5 waves, there should be a correction against the first leg in 3, 7 or 11 swings. The correction should then fail & extend in another 5 waves into the direction of first leg, i.e either Higher/lower. In DAX case, Intermediate wave (B) bounce should fail below 12597.51 high in 3, 7 or 11 swings for another extension lower in Intermediate wave (C) lower.

The internals of the decline from 12597.51 high ended Minor wave 1 at 12388, Minor wave 2 ended at 12515.5, Minor wave 3 ended at 11867, Minor wave 4 ended at 12006.50, and Minor wave 5 of (A) ended at 11725. The Index is currently correcting the cycle from 12597.51 high in Intermediate wave (B) bounce as Elliott Wave Zigzag correction, where Minor wave A ended at 12028 and Minor wave B ended at 11942.5. Above from there, Minor wave C of (B) remains in progress and expected to find sellers at 12242.73-12314.26, which is the 100%-123.6% Fibonacci extension area of A-B. The Index should extend lower in Intermediate wave (C) lower as far as pivot from February 26, 2018 peak (12597.51) remains intact. Also, it’s important to note that the 1-hour Chart below is showing bearish sequence tag, which represents the incomplete sequence to the downside. We don’t like buying it and once it reaches 12242.73-12314.26 100%-123.6% Fibonacci extension area of A-B, we are expecting sellers to appear again for 3 waves reaction lower at least.

DAX 1 Hour Elliott Wave Chart
Ayoub Ben Rejeb غير متواجد حالياً  
رد مع اقتباس
عضو نشيط
 
تاريخ التسجيل: Dec 2013
الدولة: Tunisia
المشاركات: 282
خبرة السوق: أكثر من 5 سنوات
معدل تقييم المستوى: 13
Ayoub Ben Rejeb is on a distinguished road
افتراضي رد: Elliott Wave Analysis by EWF
233#
07 - 03 - 2018, 03:47 PM
DAX Elliott Wave View: Correction Ended

DAX is correcting higher degree cycle from February 2016. Short-term Elliott Wave view suggests that Primary wave ((X)) ended with the rally to 12597.51. Decline from there is unfolding as a Zigzag Elliott Wave structure where Intermediate wave (A) ended at 11725 and Intermediate wave (B) is proposed complete at 12270.50 high in New York earlier today. However, Index still needs to break below Intermediate wave (A) at 11725 to give validity to this view.

Zigzag structure is a 5-3-5 sequence and according to Elliott wave theory, after ending the first 5 waves, there should be a correction against the first leg in 3, 7 or 11 swings. The correction should then fail & extend in another 5 waves into the direction of first leg, i.e either Higher/lower. In DAX case, Intermediate wave (B) bounce appears complete at 12270.50, and Index should do another extension lower in Intermediate wave (C) lower.

The internals of Intermediate wave (A) unfolded as 5 waves Elliott Wave Impulse structure where Minor wave 1 at 12388, Minor wave 2 ended at 12515.5, Minor wave 3 ended at 11867, Minor wave 4 ended at 12006.50, and Minor wave 5 of (A) ended at 11725. Internals of Intermediate wave (B) unfolded as Elliott Wave Zigzag correction where Minor wave A ended at 12028, Minor wave B ended at 11942.5, and Minor wave C of (B) ended at 12270.50. Near term, while bounces stay below 12270.50, and more importantly below 12597.5, expect the Index to extend lower.

DAX 1 Hour Elliott Wave Chart
Ayoub Ben Rejeb غير متواجد حالياً  
رد مع اقتباس
عضو نشيط
 
تاريخ التسجيل: Dec 2013
الدولة: Tunisia
المشاركات: 282
خبرة السوق: أكثر من 5 سنوات
معدل تقييم المستوى: 13
Ayoub Ben Rejeb is on a distinguished road
افتراضي رد: Elliott Wave Analysis by EWF
234#
08 - 03 - 2018, 01:03 PM
Elliott Wave Analysis: USDJPY Correction Should Fail Below 107.9

Short Term USDJPY Elliott Wave view suggests that the rally to 107.9 ended Minor wave X. Pair is expected to resume lower while bounces stay below this level. Down from Minor wave X at 107.91, Minor wave Y is in progress as a double three Elliott Wave Structure. Minute wave ((w)) of Y ended at 105.23 as a zigzag Elliott Wave pattern. Above from there, Minute wave ((x)) is currently in progress to correct cycle from February 21 peak as a double three Elliott Wave structure in 3, 7, or 11 swing.

Internal of Minute wave ((w)) of Y unfolded as a zigzag Elliott Wave pattern where Minutte wave (a) ended at 106.35, Minutte wave (b) ended at 107.67, and Minutte wave (c) of ((w)) ended at 105.23. Up from there, internal of Minute wave ((x)) is unfolding as a double three Elliott Wave Structure where Minutte wave (w) ended at 106.46 and Minutte wave (x) ended at 105.43. Near term, expect pair to extend higher towards 106.66 – 106.95 area to end Minutte wave (y) of ((x)), then as far as pivot at 2/21 peak (107.9) stays intact, expect pair to extend lower. We don’t like buying the pair.

USDJPY 1 Hour Elliott Wave Chart
Ayoub Ben Rejeb غير متواجد حالياً  
رد مع اقتباس
عضو نشيط
 
تاريخ التسجيل: Dec 2013
الدولة: Tunisia
المشاركات: 282
خبرة السوق: أكثر من 5 سنوات
معدل تقييم المستوى: 13
Ayoub Ben Rejeb is on a distinguished road
افتراضي رد: Elliott Wave Analysis by EWF
235#
09 - 03 - 2018, 01:20 PM
Elliott Wave Analysis: Copper at Risk of Further Weaknesses

Copper (HG_F) broke below $3.5 low ($3.095) earlier today. As a result, it shows a bearish sequence from 2/16 peak ($3.272), risking for further downside. Current short term Elliott Wave view in Copper suggests that the rally to $3.272 on 2/16 ended Primary wave ((X)). The decline from there is unfolding as a double three Elliott Wave structure where Intermediate wave (W) ended at $3.0955 on 3/5 and Intermediate wave (X) ended at $3.178 on 3/6. Intermediate wave (Y) remains in progress, and while near term bounces stay below $3.178, Copper should see further downside.

Internal of Intermediate wave (W) unfolded as a zigzag Elliott Wave structure where Minor wave A of (W) ended at $3.164 on 2/21, Minor wave B of (W) ended at $3.243 on 2/23, and Minor wave C of (W) ended at $3.0955 on 3/5. A zigzag structure has a 5-3-5 subdivision and the chart is showing a nice 5 waves impulse Elliott Wave structure subdivision within Minor wave A and Minor wave C.

Intermediate wave (X) correction from $3.0955 low has a subdivision of a zigzag Elliott Wave structure. Minor wave A of (X) ended at $3.142, Minor wave B of (X) ended at $3.129, and Minor wave C of (X) ended at $3.179. Decline from $3.179 appears to be unfolding as a zigzag with first leg Minor wave A subdivided as 5 waves. Minute wave ((i)) of A ended at $3.1175, Minute wave ((ii)) of A ended at $3.1445, Minute wave ((iii)) of A ended at $3.0705, Minute wave ((iv)) of A ended at $3.087, and Minute wave ((v)) of A appears complete at 3.055. Minor wave B bounce is in progress to correct cycle from 3/6 high in 3, 7, or 11 swing. While Minor wave B bounce stays below $3.179, expect Copper to extend lower.

Copper 1 Hour Elliott Wave Chart
Ayoub Ben Rejeb غير متواجد حالياً  
رد مع اقتباس
عضو نشيط
 
تاريخ التسجيل: Dec 2013
الدولة: Tunisia
المشاركات: 282
خبرة السوق: أكثر من 5 سنوات
معدل تقييم المستوى: 13
Ayoub Ben Rejeb is on a distinguished road
افتراضي رد: Elliott Wave Analysis by EWF
236#
26 - 03 - 2018, 12:34 PM
Will Trade War Weigh on the Market?

Trade war with China Hurt Global Economy
Last week global stock market slumped due to the prospect of all-out trade war which could destabilize global economy. US market closed sharply lower for the week with S&P 500 falling 5.6% and Dow Jones Industrial Average falling 6%. Asia markets also skidded with Nikkei 225 falling 6.3%, Hang Seng dropping 6.4%, and Shanghai Composite shed 6.4%. On Thursday, the White House moved forward with the long promised anti-China sanctions with the announcement of new tariffs on up to $60 billion in Chinese imports.

Trump said this measure is to penalize Beijing for allegedly stealing U.S companies’ intellectual property. The tariffs follow after the result of investigation in Chinese policies last August. The review found unfair practices in China, including restriction on foreign ownership without the transfer of technology. The administration says that the theft of intellectual property has been happening for decades. The new trade sanctions has identified more than 1000 Chinese products which can be potential target of 25% tariffs. The US is also trying to limit Chinese investment in the US and purse legal action against China at the World Trade Organization.

China’s promise to retaliate
Beijing has said that it is not afraid of a trade war, but it hopes to avoid it through continued dialog. On Friday, China gave initial counter proposal of 128 US products as potential retaliation targets. The products include wine, groceries, and aluminium scrap which have an import value of $3 billion. China’s response is still quite restrained so far as it tries to avoid a full blown trade war.

Despite potential retaliation by China, the White House believes China has more to lose in the event of a full blown trade war. The US imports billions more goods from China every year than it exports, creating a deficit of $375 billion in 2017. On Thursday Trump said that he has asked China to cut the deficit by $100 billion immediately. China is the third largest market for US exports and a very big buyer of American soybeans, corn, pork, and aircraft. In the event of a full-blown trade war, many US industries will be affected and no one will win.

Best and Worst Case of Trade War for Financial Market
In the best case scenario, the latest trade war declaration is Trump’s attempt to use it as a bargaining tactic to force China to negotiating table. We have an example from the last controversial import tariffs on steel and aluminium. In the previous steel tariff, six major trading partners have since been excluded, including the EU, Canada, South Korea, and Mexico. Thus, it’s possible that China’s tariff could be subject to revision and even exemptions after extensive talks with Chinese leadership. In this scenario, after the initial shakeout and fear in financial market, it can quickly recover and even extend the 9 year rally. However, Trump’s deal-making nature can also lead to miscalculation. In the worst case scenario, we could be in a full-blown trade war with increasing retaliatory tariff hikes and sanctions. In this case, global economy could come into halt and financial markets would have further correction.

Short Term Forecast for US Market


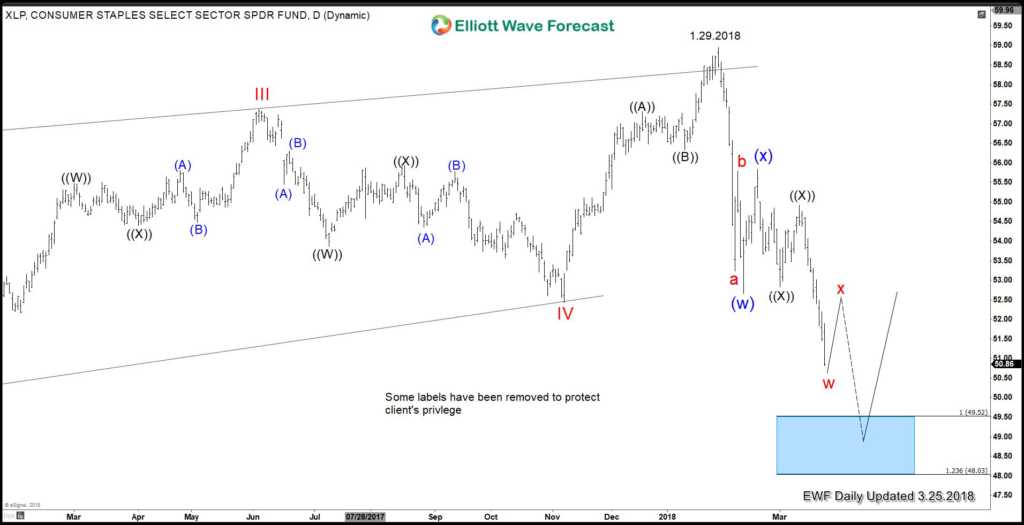
Our Elliott Wave Forecast for XLP, a consumer staple sectors ETF, suggests the market has further downside. The fund’s top holdings include stocks such as Procter & Gamble, Coca Cola, PepsiCo, and Walmart. XLP shows incomplete bearish sequence from 1.29.2018 peak ($58.95). It has further downside to at least $48.03 – $49.52 to complete Elliott Wave Double Three Structure. A double three Elliott Wave Structure has a WXY label. Down from 1.29.2018 high ($58.95), Intermediate wave (W) ended at $52.66 and Intermediate wave (X) ended at $55.84. Intermediate wave (Y) is in progress towards $48.03 – $49.52 before the instrument see support for a 3 waves bounce at least.
Ayoub Ben Rejeb غير متواجد حالياً  
رد مع اقتباس
عضو نشيط
 
تاريخ التسجيل: Dec 2013
الدولة: Tunisia
المشاركات: 282
خبرة السوق: أكثر من 5 سنوات
معدل تقييم المستوى: 13
Ayoub Ben Rejeb is on a distinguished road
افتراضي رد: Elliott Wave Analysis by EWF
237#
27 - 03 - 2018, 05:49 PM
DAX Elliott Wave Analysis: Further Weakness Ahead?

Short term Elliott Wave view in DAX suggests Primary wave ((B)) ended at 12434.7 on 3.16.2018. The decline from there is unfolding as a 5 waves impulse Elliott Wave structure. Down from 12434.7, Minor wave 1 ended at 12160, Minor wave 2 ended at 12375.5, Minor wave 3 ended at 11827, Minor wave 4 ended at 11987.50, and Minor wave 5 is proposed complete at 11706.50. The 5 waves move lower ended Intermediate wave (1) of a higher degree.

Intermediate wave (2) bounce is in progress to correct cycle from 3.16.2018 high as a zigzag Elliott Wave structure. A zigzag is a 5-3-5 structure and has a label of ABC. Potential target for Intermediate wave (2) is 12068.9 – 12261.06, which is the 50 – 76.4% retracement of the decline from 3.16.2018 high. As far as pivot at 3.16.2018 high (12434.7) stays intact during the bounce, expect Index to extend lower again afterwards. We don’t like buying the Index.

DAX 1 Hour Elliott Wave Chart
Ayoub Ben Rejeb غير متواجد حالياً  
رد مع اقتباس
عضو نشيط
 
تاريخ التسجيل: Dec 2013
الدولة: Tunisia
المشاركات: 282
خبرة السوق: أكثر من 5 سنوات
معدل تقييم المستوى: 13
Ayoub Ben Rejeb is on a distinguished road
افتراضي رد: Elliott Wave Analysis by EWF
238#
27 - 03 - 2018, 09:02 PM
Bitcoin Elliott Wave Analysis Looking for Short Term Recovery

Bitcoin Elliott Wave Analysis in the short term is showing an interesting corrective structure suggesting a recover to take place after it finishes the current move.

The digital instrument is correcting the cycle from 03/18 low in 3 waves as a Zigzag structure which reached the 100% – 161.8% Fibonacci extension area $8093 – $7520 from where it’s expected to resume a new cycle to the upside or at least bounce in 3 waves as long as it remain above $7320 low.

Bitcoin Elliott Wave 1H Chart 03.27.2018


If Bitcoin manage to break above 03/23 peak then it will continue the bounce higher toward $9550 – $10080 area correcting the cycle from 02/20 peak before another pullback can be seen. In case the short term bounce fail and BTC breaks below $7320 low, then it will open an extension lower toward $6600 – $6000 area.

Bitcoin Elliott Wave views can be used for trading purpose if certain conditions are met which we do provide for our clients. Moreover, the blue box areas in our charts are a high frequency areas where the Markets are likely to end cycles and make a turn. Consequently, BTC most likely will react from current levels.
Ayoub Ben Rejeb غير متواجد حالياً  
رد مع اقتباس
عضو نشيط
 
تاريخ التسجيل: Dec 2013
الدولة: Tunisia
المشاركات: 282
خبرة السوق: أكثر من 5 سنوات
معدل تقييم المستوى: 13
Ayoub Ben Rejeb is on a distinguished road
افتراضي رد: Elliott Wave Analysis by EWF
239#
30 - 03 - 2018, 05:48 PM
GBPUSD Elliott Wave View: Calling The Bounce Higher

GBPUSD Elliott Wave short-term sequence from 3/01 low (1.3709) ended as a Leading Diagonal structure in Minor wave 1 at 1.4248 high in 5 waves. Down from there, the pair is correcting that cycle in Minor wave 2 pullback in 3, 7 or 11 swings before it resumes the upside. So far pair is showing 3 swings back from the peak, which we are labeling as a Zigzag correction. Where Minute wave ((a)) ended with internal distribution of 5 waves at 1.4065 low and Minute wave ((b)) bounce ended in 3 swings at 1.4199 high.

Below from there, Minute wave ((c)) remain in progress with internal distribution of another 5 waves. Where Minutte wave (i) of ((c)) ended at 1.4133, Minutte wave (ii) of ((c)) ended at 1.4181. Then Minutte wave (iii) of ((c)) ended at 1.4059 and Minutte wave (iv) of ((c)) ended at 1.4095. And below from there, Minutte wave (v) of ((c)) remain in progress which has managed to reach the 100%-123.6% ext area of ((a))-((b)) already at 1.4018-1.3975 area. And soon as far as a pivot from 3/01 low (1.3709) remains intact pair is expected to resume the upside once again. We don’t like selling the pair into a proposed pullback and expect buyers to appear again at 1.4018-1.3975 for 3 wave bounce at least.

GBPUSD Elliott Wave 1 Hour Chart


Ayoub Ben Rejeb غير متواجد حالياً  
رد مع اقتباس
عضو نشيط
 
تاريخ التسجيل: Dec 2013
الدولة: Tunisia
المشاركات: 282
خبرة السوق: أكثر من 5 سنوات
معدل تقييم المستوى: 13
Ayoub Ben Rejeb is on a distinguished road
افتراضي رد: Elliott Wave Analysis by EWF
240#
03 - 04 - 2018, 06:04 PM
SPX Elliott Wave View: Further Weaknesses Likely

SPX Elliott Wave view suggests rally to 2801.90 on 3/13/2018 ended Primary wave ((X)). Decline from there is unfolding as a double three Elliott Wave structure where Intermediate wave (W) ended at 2585.89 and Intermediate wave (X) ended at 2674.22. Subdivision of Intermediate wave (W) unfolded as another double three of a lower degree where Minor wave W ended at 2694.59, Minor wave X ended at 2739.14, and Minor wave Y of (W) ended at 2585.89. Subdivision of Intermediate wave (X) unfolded as a zigzag Elliott Wave structure where Minor wave A ended at 2639.26, Minor wave B ended at 2601.81, and Minor wave C of (X) ended at 2676.54.

Intermediate wave (Y) is currently in progress as a zigzag Elliott Wave structure. A zigzag is a 5-3-5 Elliott Wave structure with ABC label. The subdivision of wave A is in 5 waves and the subdivision of wave C is also in 5 waves. In the case of SPX, decline from 2676.54 is unfolding as 5 waves impulse Elliott Wave structure where Minute wave ((i)) ended at 2593.06, Minute wave ((ii)) ended at 2659.07, Minute wave ((iii)) ended at 2553.80, and Minute wave ((iv)) is proposed complete at 2586.38.

Expect Index to extend lower 1 more time to end Minute wave ((v)) towards 2509.45 – 2540.78 and this next leg lower should also complete Minor wave A of a zigzag from 3.28.2018 high (2676.54). Afterwards, expect Index to bounce in Minor wave B in 3, 7, or 11 swing to correct cycle from 3.28.2018 high before the decline resumes. We don’t like buying the Index.

SPX Elliott Wave 1 Hour Chart
Ayoub Ben Rejeb غير متواجد حالياً  
رد مع اقتباس


إضافة رد

الكلمات الدلالية (Tags)
commodity, elliott wave, forex, stocks


جديد مواضيع منتدى تداول العملات العام

المواضيع المتشابهه
الموضوع كاتب الموضوع المنتدى مشاركات آخر مشاركة
elliott wave Nnana123 منتدى تداول العملات العام 6 11 - 04 - 2015 07:07 PM


12:19 PM