• 12:20 مساءاً


Elliott Wave Analysis by EWF

إضافة رد
Like Tree17Likes

أدوات الموضوع
عضو نشيط
 
تاريخ التسجيل: Dec 2013
الدولة: Tunisia
المشاركات: 282
خبرة السوق: أكثر من 5 سنوات
معدل تقييم المستوى: 13
Ayoub Ben Rejeb is on a distinguished road
افتراضي رد: Elliott Wave Analysis by EWF
251#
04 - 05 - 2018, 05:33 PM
Elliott Wave View: Gold Entering Buying Areas

Gold short-term Elliott Wave view suggests that the rally to 4/11 high at 1365.24 ended Minor wave B. Below from there, the decline is unfolding as an impulse Elliott wave structure in Minor wave C of (B) lower. This structure forms a bigger FLAT Elliott Wave structure which starts from 1/25 peak. Internals of each leg to the downside, i.e. wave ((i)), ((iii)), and ((v)), shows a 5 waves structure subdivision in the lesser degree with extension in the third wave.

Down from 1365.24 high, Minute wave ((i)) of C ended in 5 waves at 1332.78. Minute wave ((ii)) of C ended as a Zigzag Elliott Wave structure at 1356.24. Minute wave ((iii)) of C ended in another 5 waves structure at 1301.5 low. Above from there, the bounce in Minute wave ((iv)) of C appears complete as a double three Elliott Wave structure at yesterday’s high at 1318.1. However, a break below 1301.5 low remains to be seen to confirm the next leg lower in Minute wave ((iv)) of C bounce. Until then, a double correction higher in Minute wave ((iv)) bounce can’t be ruled out.

The entire FLAT structure from 1/25 peak has reached 100% target at 1302.1, thus the cycle is mature and Intermediate (B) could end any moment. However, near-term, while bounces fail below 1318.1 high and more importantly the pivot from 1356.24 high stays intact, gold has scope to see another push lower. Potential target for Minute wave ((v)) of C, if it happens, comes at 1295.55 – 1297.92 which is the 1.236%-1.382% inverse Fibonacci extension of a Minute wave ((iv)). Afterwards, the metal is expected to resume the upside or should produce a bounce in 3 swings at least. We don’t like selling it.

Gold 1 Hour Elliott Wave Chart
Ayoub Ben Rejeb غير متواجد حالياً  
رد مع اقتباس

عضو نشيط
 
تاريخ التسجيل: Dec 2013
الدولة: Tunisia
المشاركات: 282
خبرة السوق: أكثر من 5 سنوات
معدل تقييم المستوى: 13
Ayoub Ben Rejeb is on a distinguished road
افتراضي رد: Elliott Wave Analysis by EWF
252#
11 - 05 - 2018, 05:48 PM
CADJPY Elliott Wave View: Calling Strength Higher

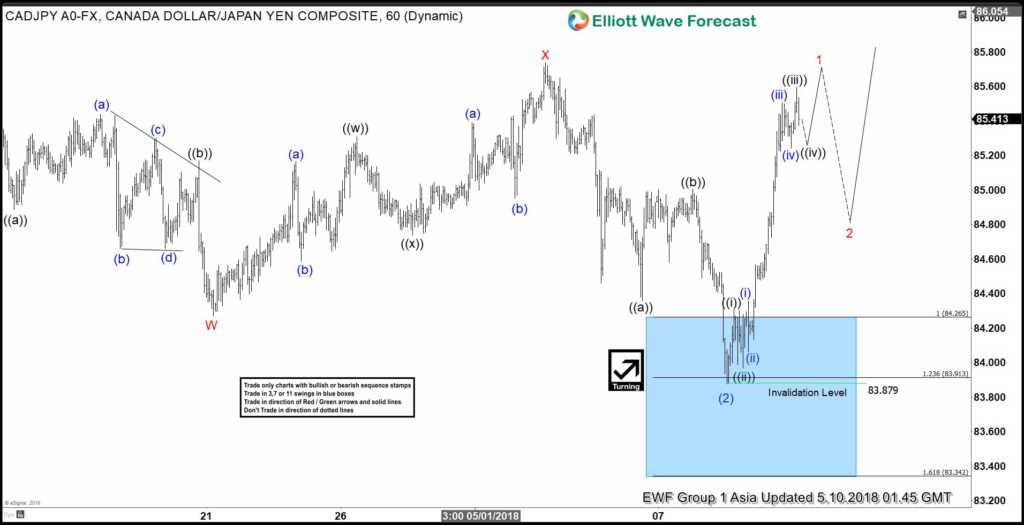
CADJPY Short Term Elliott Wave view suggests that the decline from 4/13 peak at 85.76 to 83.87 low ended Intermediate wave (2) as a double three Elliott Wave structure. The internal subdivision of the decline from 85.76 high shows an overlapping structure. This suggests the decline is corrective in nature. We label the correctin as W-X-Y.

Down from 4/13 peak (85.76), Minor wave W unfolded as a Zigzag Elliott wave structure. Minute wave ((a)) of W ended at 84.88, Minute wave ((b)) of W ended at 85.17 high, and Minute wave ((c)) of W ended at 84.27 low. Up from there, Minor wave X bounce also unfolded as a double three Elliott Wave structure. Minute wave ((w)) of X ended at 85.31, Minute wave ((x)) of X ended at 84.74 and Minute wave () of X ended at 85.74. The internal of Minor wave Y subdivided as a zigzag structure. Minute wave ((a)) of Y ended at 84.36, Minute wave ((b)) of Y ended at 85, and Minute wave ((c)) of Y ended at 83.87 low. The move lower to 83.87 also ended Intermediate wave (2) upon reaching 100%-123.6% Fibonacci extension area of Minor W-X at 83.91 – 84.26.

Above from there, the pair has made a strong rally to the upside in an impulse Elliott Wave structure. Due to the 5 waves impulse, it favors the continuation higher in Intermediate wave (3). However, a break above 4/13 high 85.75 is needed for the final confirmation of the next leg higher. Until then, a double correction lower in intermediate wave (2) still can’t be ruled out. Near-term, as far as dips remain above 83.87 low, expect pair to resume higher. We don’t like selling it.

CADJPY Elliott Wave 1 hour Chart
Ayoub Ben Rejeb غير متواجد حالياً  
رد مع اقتباس
عضو نشيط
 
تاريخ التسجيل: Dec 2013
الدولة: Tunisia
المشاركات: 282
خبرة السوق: أكثر من 5 سنوات
معدل تقييم المستوى: 13
Ayoub Ben Rejeb is on a distinguished road
افتراضي رد: Elliott Wave Analysis by EWF
253#
16 - 05 - 2018, 05:19 PM
DAX Elliott Wave Analysis: Ending The Wave 3 Soon

DAX Elliott Wave view in shorter cycles suggests that the rally from March 26.2018 low (11704) is extending higher in Impulse sequence with extension in the 3rd wave. It’s important to note that an impulse structure should have internal subdivision of lesser degree 5 waves impulse. And in particular, DAX’s case, Minute wave ((i)), ((ii)) and ((v)) within wave Minor degree should have an internal subdivision of 5 waves impulse Elliott Wave structure of lesser degree.

The rally to 12152.62 ended Minute wave ((i)) of 3 in 5 waves structure, Minute wave ((ii)) of 3 ended at 11792.29 low. Then the rally to 12639.73 high ended Minute wave ((iii)) of 3 in 5 waves and pullback to 12319.80 ended Minute wave ((iv)) of 3 as a Flat correction. Above from there, the rally is unfolding in another 5 waves structure in Minute wave ((v)) of 3. Near-term, although the index has a minimum amount of swings in placed already to end the Minor wave 3. But while dips remain above 12319.80 low index is expected to extend 1 more push higher towards 13276.55 area approximately. Afterwards, the index is expected to do a pullback in Minor wave 4 in 3, 7 or 11 swings before further upside is seen. We don’t like selling it.

DAX Elliott Wave 1 Hour Chart
Ayoub Ben Rejeb غير متواجد حالياً  
رد مع اقتباس
عضو نشيط
 
تاريخ التسجيل: Dec 2013
الدولة: Tunisia
المشاركات: 282
خبرة السوق: أكثر من 5 سنوات
معدل تقييم المستوى: 13
Ayoub Ben Rejeb is on a distinguished road
افتراضي رد: Elliott Wave Analysis by EWF
254#
22 - 05 - 2018, 06:18 PM
USDCAD Extending Lower As Elliott Wave Impulse

USDCAD short-term Elliott Wave view suggests that the bounce to 1.2998 on 5/08 high ended primary wave ((2)). Below from there, primary wave ((3)) remains in progress as an Impulse Elliott Wave structure looking for more downside extension. In Impulse wave, the subdivision of wave 1, 3, and 5 is also an impulse structure of a lesser degree. On the other hand, wave 2 & 4 are corrective in nature i.e double, triple three, Flat etc. In the case of USDCAD, Intermediate wave 1, 3 and 5 are impulse with sub-division of 1, 2, 3, 4 & 5 in Minor degree.

Down from 1.2998 high, the pair ended intermediate wave (1) in 5 waves at 1.2725 low. Then the bounce to 1.2924 high ended intermediate wave (2) as zigzag and the correction against 5/08 high (1.2998). Below from there, Intermediate wave (3) of ((3)) is in progress looking for more downside extension as an impulse. Minor degree wave 1 of (3) ended in 5 waves at 1.2745 low and the bounce to 1.2911 high ended Minor wave 2 of (3) as a zigzag correction. Near-term focus remains towards 1.2733-1.2691, 100%-123.6% Fibonacci extension area of wave 1 & 2, to end the Minute degree wave ((i)) of 3 lower. Afterwards, the pair should bounce in Minute wave ((ii)) to correct the cycle from 1.2911 high before further decline resumes. We don’t like buying the proposed bounces.

USDCAD 1 Hour Elliott Wave Chart
Ayoub Ben Rejeb غير متواجد حالياً  
رد مع اقتباس
عضو نشيط
 
تاريخ التسجيل: Dec 2013
الدولة: Tunisia
المشاركات: 282
خبرة السوق: أكثر من 5 سنوات
معدل تقييم المستوى: 13
Ayoub Ben Rejeb is on a distinguished road
افتراضي رد: Elliott Wave Analysis by EWF
255#
23 - 05 - 2018, 05:59 PM
GBPUSD Elliott wave view in short-term cycle suggests that the decline from 4/17/2018 high (1.4377) is unfolding as an impulse Elliott wave structure where bounce to 1.3607 high ended Intermediate wave (4). Down from there, intermediate wave (5) remains in progress as Elliott Wave ending diagonal structure. Ending diagonal usually appears in the sub-division of wave (5) of impulse or wave (C) of a Zigzag correction with internal distribution of 3-3-3-3-3 corrective structure. It also commonly shows a wedge shape and has overlap between wave 1 & 4 when wave 4 may or may not enter the territory of wave 1.

In the case of GBPUSD, the decline from 1.3607 high to 1.3450 ended Minor wave 1 of (5) as a zigzag structure. Then the bounce to 1.3569 high ended Minor wave 2 of (5) in 3 swings as a zigzag structure. Down from there, the decline to 1.3389 low ended Minor wave 3 of (5) as Elliott wave double three structure. Above from there, the bounce to 1.3492 high ended Minor wave 4 of (5) which shows the overlap with Minor wave 1. Near-term, below from 1.3492 high, Minor wave 5 of (5) remains in progress which can extend to 1.3333-1.3295. This area is where Minor wave 5 = Minor wave 1 or 100%-123.6% Fibonacci extension area to end the cycle from 4/17/2018 peak. Afterwards, the pair is expected to do a bounce in 3 swings at least. We don’t like buying it into proposed bounces.

GBPUSD Elliott wave 1 Hour Chart
Ayoub Ben Rejeb غير متواجد حالياً  
رد مع اقتباس
عضو نشيط
 
تاريخ التسجيل: Dec 2013
الدولة: Tunisia
المشاركات: 282
خبرة السوق: أكثر من 5 سنوات
معدل تقييم المستوى: 13
Ayoub Ben Rejeb is on a distinguished road
افتراضي رد: Elliott Wave Analysis by EWF
256#
23 - 05 - 2018, 06:15 PM
The Hang Seng Index Larger Bullish Cycles

Firstly the Hang Seng index larger bullish cycles has been trending higher with other world indices. In April 2003 it put in a huge degree pullback low. From there the index rallied with other world indices again until October 2007. It then corrected the rally as did most other world stock indices. It ended this larger degree correction in October 2008. From those 2008 lows, the index shows a 5 swing sequence that favors further upside. Price has reached and exceeded the area of 29410 – 32040 which is the .618 – .764 Fibonacci extension of the 2008 to 2015 cycle.

The way this is measured is as follows. Use a Fibonacci extension tool on a charting platform. Point 1 will be at the beginning of the cycle at the 2008 lows. From there on up to the 2015 highs will be point 2. The point 3 will be down at the 2016 lows. As previously mentioned, the index in January 2018 saw the .618 – .764 Fibonacci extension of the 2008 to 2015 cycle. In most cases a fifth swing will end in this Fibonacci extension area however this index has been a bit more bullish. Analysis continues below the chart.

Hang Seng Index Weekly Chart


In conclusion . Currently the Hang Seng pullback from the 5th swing high ended the cycle up from the 2016 lows. It did a 3 swing pullback to the February 2018 lows to complete the 6th swing. At this point it is favored to remain above there during dips. Worst case if it remains below the January 2018 highs it can continue a pullback in the 6th swing in 3 more swings. This would make a possible 7, or 11 swings to correct the cycle up from the 2016 low which should be similar to the 2nd swing pullback of 2011. Afterward of completion of the 6th swing pullback it should see more upside in the 7th swing toward 36314.
Ayoub Ben Rejeb غير متواجد حالياً  
رد مع اقتباس
عضو نشيط
 
تاريخ التسجيل: Dec 2013
الدولة: Tunisia
المشاركات: 282
خبرة السوق: أكثر من 5 سنوات
معدل تقييم المستوى: 13
Ayoub Ben Rejeb is on a distinguished road
افتراضي رد: Elliott Wave Analysis by EWF
257#
25 - 05 - 2018, 01:08 PM
Elliott Wave Analysis: EURJPY Has a Bearish Sequence

EURJPY short-term Elliott Wave view suggests that the bounce to 5/14 high at 131.38 ended Minor wave B. Down from there, the decline is unfolding as Elliott wave impulsive structure in Minor wave C lower. The internal sub-division of each leg lower is showing 5 waves structure in lesser degree cycles, which is characteristic of an an impulse. Also, it’s important to note here that the below chart is showing a bearish sequence tag, which refers to the incomplete downward structure in the pair.

Below from 131.38 high the lesser degree Minutte wave (i) of ((i)) ended in 5 waves structure at 129.49. Above from there, the bounce to 131.35 high ended Minutte wave (ii) of ((i)) as a double three structure. Then the decline to 128.22 low ended in Minutte wave (iii) of ((i)) with another 5 waves structure. Up from there, the lesser degree Minutte wave (iv) of ((i)) ended at 129.06 high. Down from there, Minutte wave (v) of ((i)) ended at 127.94 low in another 5 waves. Above from there, the pair is correcting the short-term cycle from 131.38 high within Minute wave ((ii)) bounce which is epxected to fail in 3, 7 or 11 swings for further downside extension. We don’t like buying it into a proposed bounce.

EURJPY Elliott Wave 1 Hour Chart
Ayoub Ben Rejeb غير متواجد حالياً  
رد مع اقتباس
عضو نشيط
 
تاريخ التسجيل: Dec 2013
الدولة: Tunisia
المشاركات: 282
خبرة السوق: أكثر من 5 سنوات
معدل تقييم المستوى: 13
Ayoub Ben Rejeb is on a distinguished road
افتراضي رد: Elliott Wave Analysis by EWF
258#
29 - 05 - 2018, 01:32 PM
EURUSD Elliott Wave View: Bounces Are Expected To Fail

EURUSD short-term Elliott wave view suggests that the decline from ( 1.1996 ) 5/14/2018 peak is unfolding as ending diagonal structure in Intermediate wave (5) lower as mentioned in the previous post here. The internals of each of leg in ending diagonal structure is the combination of a 3 waves corrective structure i.e the internal of wave 1, 2, 3, 4 & 5 unfolds as double three, zigzag etc. Ending Diagonal usually appears in the sub-division of the wave 5 of impulse or wave C of Zigzag or Flat.

Down from 1.1996 high, the decline to 1.1715 low ended Minor wave 1 lower. Then the bounce to 1.183 high ended Minor wave 2 bounce as double three structure. Below from there, Minor wave 3 remains in progress as Elliott wave double three structure where internal Minute wave ((w)) of 3 ended at 1.1644. The bounce to 1.173 at yesterday’s high ended Minute wave ((x)) of 3. Near-term focus remains towards 1.1544-1.1500, which is 100%-123.6% Fibonacci extension area of Minute ((w))-((x)) to end the Minute wave ((y)) of 3. Afterwards, the pair is expected to do a bounce in Minor wave 4 which should then fail below 1.1833 high in 3, 7 or 11 swings for more downside. We don’t like buying it the pair.

EURUSD 1 Hour Elliott Wave Chart
Ayoub Ben Rejeb غير متواجد حالياً  
رد مع اقتباس
عضو نشيط
 
تاريخ التسجيل: Dec 2013
الدولة: Tunisia
المشاركات: 282
خبرة السوق: أكثر من 5 سنوات
معدل تقييم المستوى: 13
Ayoub Ben Rejeb is on a distinguished road
افتراضي رد: Elliott Wave Analysis by EWF
259#
29 - 05 - 2018, 05:48 PM
The CAC 40 Index Long Term Bullish Cycles

Firstly the CAC 40 index long term bullish cycles have been trending higher with other world indices. In September 2000 it put in an all time high. From there it followed the rest of the world indices lower into the March 2003 lows which was a larger degree pullback. From there the index rallied with other world indices again until June 2007. It then corrected the rally again as did most other world stock indices. It ended this larger degree correction in March 2009. From those 2009 lows, the index shows a 5 swing sequence that favors further upside.

Secondly, in January 2018 price had nearly reached the area of 5623 – 6034 which is the .618 – .764 Fibonacci extension of the 2008 to 2015 cycle. This is a usual area for a 5th swing of a cycle. The thought here is that momentum indicators suggest it ended the cycle from the 4th swing low which was in February 2016. The dip to the March 2018 lows in the 6th swing corrected the cycle up from February 2016 lows. The analysis continues below the chart.

CAC 40 Index Monthly Chart


I would like to briefly mention how the extension areas are measured which is as follows. Use a Fibonacci extension tool on a charting platform. On this chart, point 1 will be at the beginning of the cycle at the 2009 lows. From there on up to the 2015 highs, marked with a 3, will be point 2. The point 3 will be down at the 2016 lows. This point is marked with a 4. The extension areas shown are the same as long as price remains above the 2016 lows. At the time of writing it is thought the index has finished the 6th swing pullback at the March 2018 lows. It should stay above there while continuing the trend higher.

Lastly in conclusion, the extension areas higher shown on the chart is where the index should be able to reach during this period of multiple world indices bullish trends higher. Conservatively the chart shows a usual target area for a 7 swing at the 6699-7364 area which likely will be surpassed before it ends the bullish cycle up from the March 2009 lows.
Ayoub Ben Rejeb غير متواجد حالياً  
رد مع اقتباس
عضو نشيط
 
تاريخ التسجيل: Dec 2013
الدولة: Tunisia
المشاركات: 282
خبرة السوق: أكثر من 5 سنوات
معدل تقييم المستوى: 13
Ayoub Ben Rejeb is on a distinguished road
افتراضي رد: Elliott Wave Analysis by EWF
260#
30 - 05 - 2018, 05:46 PM
Nikkei Elliott Wave Analysis: Pullback Remains In Progress

Nikkei short-term Elliott wave view suggests that the rally to 23060 on May 20 high ended Intermediate wave (1) as an impulse. Down from there, the index is pulling back in Intermediate wave (2) pullback to correct cycle from March 23, 2018 low in 3, 7 or 11 swings before the rally resumes. The decline from 23060 high is unfolding as Elliott wave double three structure.

Double three is a 7 swing pattern, which is a combination of two corrective patterns, including Flats, Triangles, Triple three, Zigzag etc. The two corrective patterns combine together to form the double three structure. In the case of Nikkei, the decline from 23060 high to 22075 low ended Minute wave ((w)). The internals of Minute wave ((w)) unfolded as a Zigzag structure where Minutte wave (a) ended at 22475, Minutte wave (b) ended at 22640, and Minutte wave (c) of ((w)) ended at 22075.

From 22075 low, the bounce to 22560 high ended Minute wave ((x)) recovery as zigzag structure. The Index has since made a new low below 22075 and shows 5 swings bearish sequence from May 20 high (23060). Please note that 5 swing sequence is not the same as 5 waves impulse. 5 swing sequence refers to the swing count and refers to 7 swing WXY (double three structure). The 5 swing sequence favors more downside & confirms Minute wave ((y)) lower has started. The internals of Minute wave ((y)) is also unfolding as a Zigzag structure where Minutte wave (a) ended at 21920. Near-term, while bounces fail below 22560 high, expect the Index to see another extension lower towards 21350 – 21579, which is 100%-123.6% Fibonacci extension area of Minute ((w))-((x)). Afterwards, expect the Index to at least see a 3 waves bounce. We don’t like buying the Index.

Nikkei 1 Hour Elliott Wave Chart
Ayoub Ben Rejeb غير متواجد حالياً  
رد مع اقتباس


إضافة رد

الكلمات الدلالية (Tags)
commodity, elliott wave, forex, stocks


جديد مواضيع منتدى تداول العملات العام

المواضيع المتشابهه
الموضوع كاتب الموضوع المنتدى مشاركات آخر مشاركة
elliott wave Nnana123 منتدى تداول العملات العام 6 11 - 04 - 2015 07:07 PM


12:20 PM