• 4:00 مساءاً


Elliott Wave Analysis by EWF

إضافة رد
Like Tree17Likes

أدوات الموضوع
عضو نشيط
 
تاريخ التسجيل: Dec 2013
الدولة: Tunisia
المشاركات: 282
خبرة السوق: أكثر من 5 سنوات
معدل تقييم المستوى: 13
Ayoub Ben Rejeb is on a distinguished road
افتراضي رد: Elliott Wave Analysis by EWF
181#
14 - 09 - 2017, 05:46 PM
DXY Elliott Wave View: Zigzag Correction

DXY Dollar Index Short Term Elliott Wave view suggests that the Index ended Primary wave ((3)) at 91.01 and currently in a Primary wave ((4)) bounce. Internal of Primary wave ((4)) is unfolding as a zigzag Elliott wave structure. Preferred view suggests rally to 92.01 completed Intermediate wave (A) and dip to 91.71 ended Intermediate wave (B) as an expanded Elliott wave FLAT. Expect the Index to continue higher towards 92.71 – 92.95 area to complete Primary wave ((4)). Afterwards, the Index should resume the decline lower or at least pullback in 3 waves. We don’t like buying the Dollar Index. Expect sellers to appear at 92.71 – 93.33 area for a 3 waves reaction lower at least. If the rally in the Dollar Index extends beyond 93.33 (1.168 extension), the move from 9/8 low could unfold as impulse instead.

DXY 1 Hour Elliott Wave Chart
Ayoub Ben Rejeb غير متواجد حالياً  
رد مع اقتباس

عضو نشيط
 
تاريخ التسجيل: Dec 2013
الدولة: Tunisia
المشاركات: 282
خبرة السوق: أكثر من 5 سنوات
معدل تقييم المستوى: 13
Ayoub Ben Rejeb is on a distinguished road
افتراضي رد: Elliott Wave Analysis by EWF
182#
15 - 09 - 2017, 02:01 PM
DXY Elliott Wave View 9.15.2017

DXY Dollar Index Short Term Elliott Wave view suggests that the Index ended Primary wave ((3)) at 91.01. Primary wave ((4)) bounce is proposed complete at 92.66 as a double three Elliott Wave structure. Wave (W) of ((4)) ended at 92.01, wave (X) of ((4)) ended at 91.71, and wave (Y) of ((4)) is proposed complete at 92.66. Down from there, Intermediate wave (1) ended at 91.97. Intermediate wave (2) bounce is in progress in 3, 7, or 11 swing to correct cycle from 9/14 peak. While bounces stay below there, expect Index to extend lower. We don’t like buying the Dollar Index.

DXY 1 Hour Elliott Wave Chart
Ayoub Ben Rejeb غير متواجد حالياً  
رد مع اقتباس
عضو نشيط
 
تاريخ التسجيل: Dec 2013
الدولة: Tunisia
المشاركات: 282
خبرة السوق: أكثر من 5 سنوات
معدل تقييم المستوى: 13
Ayoub Ben Rejeb is on a distinguished road
افتراضي رد: Elliott Wave Analysis by EWF
183#
18 - 09 - 2017, 05:55 PM
CADJPY Elliott Wave Sequence still bullish

CADJPY Elliott Wave Sequence is bullish and incomplete to the upside due to which we have been telling clients not to sell the pair and use the dips as an opportunity to get long for higher prices. Our Live Trading Room was able to catch a long in CADJPY for a profit of +197 pips recently and in this blog, we will take a look at CADJPY daily chart to show that the rally is not over yet and any pull backs should still be viewed as a buying opportunity in the sequence of 3, 7 or 11 swings.

CADJPY Elliott Wave Sequence from 11.9.2016


Daily chart of CADJPY shows the pair rallied in 3 waves from 11.9.2016 low to 12.15.2016 high. Then, the pair pulled back to 50 – 61.8 Fibonacci retracement area of the rally from 11.9.2016 low and made a new high above 12.15.2016 peak. As soon as pair broke above 12.15.2016 peak, it created a bullish Elliott wave sequence with a target of 94.57 – 97.91 area. We know that market doesn’t move in a straight line and always does pull backs. Since the pair broke above 12.15.2016 peak, we have been telling clients to use pull backs as a buying opportunity in 3, 7 or 11 swings. As far as dips hold above 8.11.2017 low i.e blue (X) low, pair should remain supported and see more upside towards 94.57 – 97.91 area.

CADJPY 8 Hour Elliott Wave Analysis
Pair is showing 5 swings up from 4.19.2017 low which makes Elliott wave sequence incomplete and bullish against 8.11.2017 low in this time frame. Pair has reached 0.618 – 0.764 Fibonacci extension area of (W)-(X). This is the area which will typically end 5th swing in a 7 swing sequence. Therefore, we don’t like chasing the longs here as a pull back can be seen soon in wave X. We don’t like selling the pair and expect wave X pull back to find buyers in 3, 7 or 11 swings as far as pivot at 8.11.2017 i.e. blue (X) at 85.44 low remains intact.

Ayoub Ben Rejeb غير متواجد حالياً  
رد مع اقتباس
عضو نشيط
 
تاريخ التسجيل: Dec 2013
الدولة: Tunisia
المشاركات: 282
خبرة السوق: أكثر من 5 سنوات
معدل تقييم المستوى: 13
Ayoub Ben Rejeb is on a distinguished road
افتراضي رد: Elliott Wave Analysis by EWF
184#
18 - 09 - 2017, 06:08 PM
AECOM Resuming the Rally Toward $50

AECOM (NYSE:ACM) provides planning, consulting, architectural and engineering design and program and construction management services for a range of projects including highways, airports, bridges, mass transit systems, to government and commercial clients. The company had US$17.4 billion of revenue during fiscal year 2016, it’s been ranked number one in Engineering News Record‘s “Top 500 Design Firms” for 8th consecutive year and named one of Fortune magazine’s “World’s Most Admired Companies” for the third consecutive year.

From 2008 low, AECOM stock is showing 5 swings incomplete bullish sequence which is different from the regular impulsive 5 waves move as we use this sequence as part of our new way of applying Elliott Wave Theory to the market. We believe that many instrument has the ability to trend using corrective Elliott wave structure rather then trending in 5 waves move, so this move is considered as part of a double three structure which has 7 swings.

AECOM managed last year to make new all time high, so using 2014 peak & 2016 low as a connector, the stock is looking to extend higher toward equal legs area 46.53 – 52.14 before ending the cycle from 2008 low.

AECOM Weekly Chart


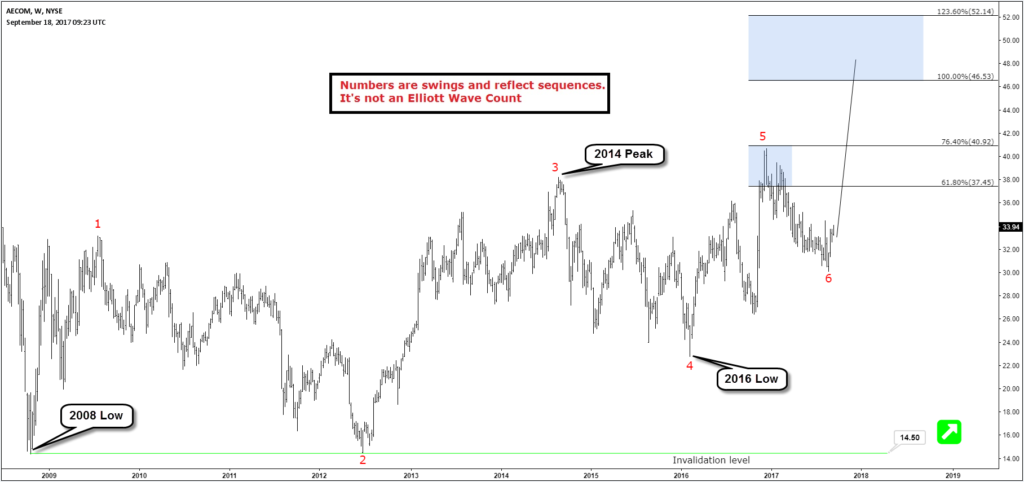
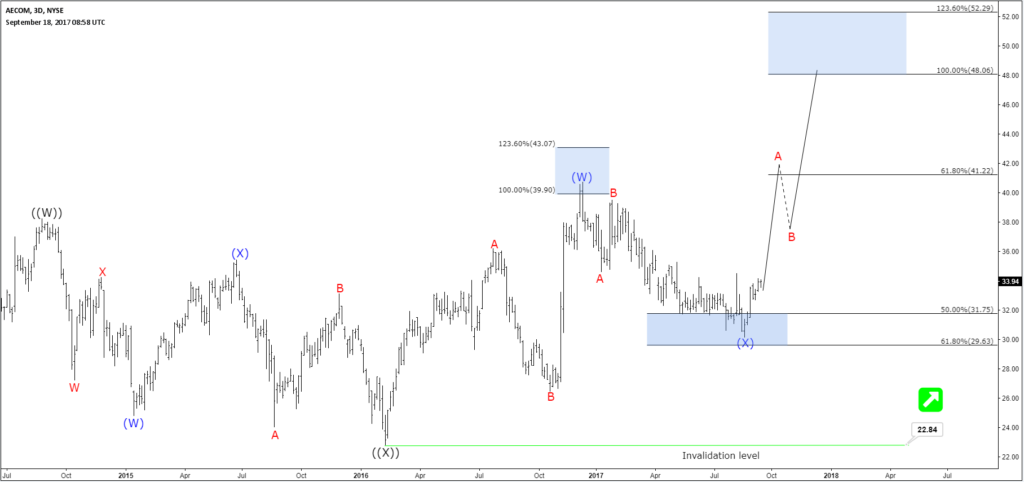
AECOM ended 3 waves pullback from 12/12/2016 peak after it reached the 50-61.8 fib retracement area 31.75 – 29.63, so currently as long as it remains above the recent August low at 30.15 and most importantly as long as 22.84 pivot keeps holding then AECOM will extend higher to make new all time highs and reach the target around the $50 area.

AECOM Daily Chart


Recap
AECOM has a bullish structure and technically it has resumed the move higher unless the move truncates without reaching the target and decide to make the double correction from 2016 peak. It’s not recommended to sell it and it’s better to look for buying opportunity during short term pullbacks using corrective structures in 3 , 7 or 11 swings.
Ayoub Ben Rejeb غير متواجد حالياً  
رد مع اقتباس
عضو نشيط
 
تاريخ التسجيل: Dec 2013
الدولة: Tunisia
المشاركات: 282
خبرة السوق: أكثر من 5 سنوات
معدل تقييم المستوى: 13
Ayoub Ben Rejeb is on a distinguished road
افتراضي رد: Elliott Wave Analysis by EWF
185#
19 - 09 - 2017, 02:11 PM
NZDUSD Elliott Wave View: More Upside

NZDUSD Short Term Elliott Wave view suggests that the Index shows a 5 swing sequence from 8/31 low favoring further upside. Rally from 8/31 low (0.7128) is unfolding as a double three Elliott Wave structure. Up from 0.7128, Minute wave ((w)) ended at 0.7338 and Minute wave ((x)) ended at 91.71. Wave ((y)) is currently in progress and the subdivision is also unfolding as a double three Elliott wave structure. Minutte wave (w) of ((y)) ended at 0.7344 and Minutte wave (x) of ((y)) ended at 0.7246. Near term, while pullbacks stay above 0.718, expect pair to extend higher. We don’t like selling the pair.

NZDUSD 1 Hour Elliott Wave Chart
Ayoub Ben Rejeb غير متواجد حالياً  
رد مع اقتباس
عضو نشيط
 
تاريخ التسجيل: Dec 2013
الدولة: Tunisia
المشاركات: 282
خبرة السوق: أكثر من 5 سنوات
معدل تقييم المستوى: 13
Ayoub Ben Rejeb is on a distinguished road
افتراضي رد: Elliott Wave Analysis by EWF
186#
21 - 09 - 2017, 06:34 PM
DXY Elliott Wave View: Double Correction

DXY Short Term Elliott Wave view suggests that the decline to 91.01 ended Primary wave ((3)). Primary wave ((4)) bounce remains in progress as a double three Elliott Wave structure. Up from 91.01, Intermediate wave (W) ended at 92.66 and Intermediate wave (X) ended at 91.591. Near term, while pullbacks stay above 91.591, expect Index to extend higher towards 93.227 – 93.618 area to complete Primary wave ((4)). Afterwards, Index should resume the decline lower or at least pullback in 3 waves. We don’t like buying the proposed bounce.

DXY 1 Hour Elliott Wave Chart
Ayoub Ben Rejeb غير متواجد حالياً  
رد مع اقتباس
عضو نشيط
 
تاريخ التسجيل: Dec 2013
الدولة: Tunisia
المشاركات: 282
خبرة السوق: أكثر من 5 سنوات
معدل تقييم المستوى: 13
Ayoub Ben Rejeb is on a distinguished road
افتراضي رد: Elliott Wave Analysis by EWF
187#
26 - 09 - 2017, 03:27 PM
Elliottwave View: AUDJPY Doing a Correction

AUDJPY Short Term Elliott Wave view suggests that the rally to 90.31 ended Intermediate wave (W). Intermediate wave (X) pullback remains in progress as a double three Elliott Wave structure. Down from 90.31, Minor wave (W) ended at 88.44 and Minor wave (X) ended at 89.68. Near term, while bounces stay below 90.31, expect pair to extend lower towards 87.36 – 87.8 area to complete Intermediate wave (X). Afterwards, pair should resume the rally to a new high or at least bounce in 3 waves. We don’t like selling the proposed pullback.

AUDJPY 1 Hour Elliottwave Chart
Ayoub Ben Rejeb غير متواجد حالياً  
رد مع اقتباس
عضو نشيط
 
تاريخ التسجيل: Dec 2013
الدولة: Tunisia
المشاركات: 282
خبرة السوق: أكثر من 5 سنوات
معدل تقييم المستوى: 13
Ayoub Ben Rejeb is on a distinguished road
افتراضي رد: Elliott Wave Analysis by EWF
188#
28 - 09 - 2017, 01:58 PM
Elliott Wave Analysis: AUDJPY Correction Near Complete

AUDJPY Short Term Elliott Wave view suggests that the rally to 90.31 ended Intermediate wave (W). Intermediate wave (X) pullback remains in progress as a double three Elliott Wave structure. Down from 90.31, Minor wave W ended at 88.44 and Minor wave X ended at 89.68. Minor wave Y is unfolding also as a double three Elliott Wave structure. Minute wave ((w)) of Y ended at 88.23 and Minute wave ((x)) of Y is proposed complete at 88.89. Near term, while bounces stay below 9/21 peak at 90.31, expect pair to extend lower towards 87.36 – 87.8 area to complete Intermediate wave (X). Afterwards, pair should resume the rally to a new high or at least bounce in 3 waves. We don’t like selling the proposed pullback.

AUDJPY 1 Hour Elliottwave Chart
Ayoub Ben Rejeb غير متواجد حالياً  
رد مع اقتباس
عضو نشيط
 
تاريخ التسجيل: Dec 2013
الدولة: Tunisia
المشاركات: 282
خبرة السوق: أكثر من 5 سنوات
معدل تقييم المستوى: 13
Ayoub Ben Rejeb is on a distinguished road
افتراضي رد: Elliott Wave Analysis by EWF
189#
29 - 09 - 2017, 11:49 AM
AUDJPY Elliott Wave Analysis 9.29.2017

AUDJPY Short Term Elliott Wave view suggests that the rally to 90.31 ended Intermediate wave (W). Intermediate wave (X) pullback remains in progress as a double three Elliott Wave structure. Down from 90.31, Minor wave W ended at 88.44 and Minor wave X ended at 89.68. Minor wave Y is unfolding also as a double three Elliott Wave structure. Minute wave ((w)) of Y ended at 88.23 and Minute wave ((x)) of Y is proposed complete at 88.89. Near term, while bounces stay below 9/25 peak at 89.69, expect pair to extend lower towards 87.37 – 87.8` area to complete Intermediate wave (X). Afterwards, pair should resume the rally to a new high or at least bounce in 3 waves. We don’t like selling the proposed pullback.

AUDJPY 1 Hour Elliottwave Chart
Ayoub Ben Rejeb غير متواجد حالياً  
رد مع اقتباس
عضو نشيط
 
تاريخ التسجيل: Dec 2013
الدولة: Tunisia
المشاركات: 282
خبرة السوق: أكثر من 5 سنوات
معدل تقييم المستوى: 13
Ayoub Ben Rejeb is on a distinguished road
افتراضي رد: Elliott Wave Analysis by EWF
190#
03 - 10 - 2017, 06:45 PM
Elliott Wave Analysis: EURUSD in a flat correction

EURUSD Short Term Elliott Wave view suggests that the decline from 9/8 peak is unfolding as an expanded Flat Elliott Wave structure. Down from 9/8 high (1.2094), Intermediate wave (A) ended at 1.1837 and Intermediate wave (B) ended at 1.2034. Intermediate wave (C) is in progress as 5 waves. Minor wave 1 of (C) ended at 1.186, and bounce to 1.2 ended Minor wave 2 of (C). Down from there, Minor wave 3 of (C) ended at 1.1716, and bounce to 1.1832 ended Minor wave 4 of (C). Minor wave 5 of (C) remains in progress and can reach as low as 1.16207. This area will also complete Primary wave ((W)) and end cycle from 9/8 peak. Afterwards, pair should bounce within Primary wave ((X)) to correct cycle from 9/8 peak in 3, 7, or 11 swing before turning lower again.

Alternatively, if pair extends below 1.16207, then the entire move lower from 9/8 high could be labelled as 5 waves impulse. In this case, the current decline will only end Intermediate wave (3). Then pair should bounce in Intermediate wave (4) before the decline resumes again.

EURUSD 1 Hour Elliott Wave Chart
Ayoub Ben Rejeb غير متواجد حالياً  
رد مع اقتباس


إضافة رد

الكلمات الدلالية (Tags)
commodity, elliott wave, forex, stocks


جديد مواضيع منتدى تداول العملات العام

المواضيع المتشابهه
الموضوع كاتب الموضوع المنتدى مشاركات آخر مشاركة
elliott wave Nnana123 منتدى تداول العملات العام 6 11 - 04 - 2015 07:07 PM


04:00 PM