• 11:18 صباحاً


Elliott Wave Analysis by EWF

إضافة رد
Like Tree17Likes

أدوات الموضوع
عضو نشيط
 
تاريخ التسجيل: Dec 2013
الدولة: Tunisia
المشاركات: 282
خبرة السوق: أكثر من 5 سنوات
معدل تقييم المستوى: 13
Ayoub Ben Rejeb is on a distinguished road
افتراضي رد: Elliott Wave Analysis by EWF
111#
21 - 06 - 2017, 02:57 PM
DAX Elliott Wave Analysis: Bullish Against 12617

Short term DAX Elliott Wave view suggests the rally from 5/18 is unfolding as a double three Elliott Wave structure. Minute wave ((w)) ended at 12879.5 and Minute wave ((x)) pullback ended at 12617. Internal of Minute wave ((x)) subdivided as an expanded flat Elliott Wave structure where Minutte wave (a) ended at 12633.5, Minutte wave (b) ended at 12922.5 and Minutte wave (c) of ((x)) ended at 12617. DAX has broken above Minutte wave (b) on 6/14, adding conviction that the next leg higher has started. Up from 12617, the rally is unfolding as a zigzag Elliott Wave structure where Minutte wave (a) ended at 12948.5 and Minutte wave (b) is proposed complete at 12772.5. Near term, while pullbacks stay above 12772.5, and more importantly above 12617, expect Index to extend higher. We do not like selling the proposed pullback.

DAX 1 Hour Elliott Wave Chart 06/21/2017

Ayoub Ben Rejeb غير متواجد حالياً  
رد مع اقتباس

عضو نشيط
 
تاريخ التسجيل: Dec 2013
الدولة: Tunisia
المشاركات: 282
خبرة السوق: أكثر من 5 سنوات
معدل تقييم المستوى: 13
Ayoub Ben Rejeb is on a distinguished road
افتراضي رد: Elliott Wave Analysis by EWF
112#
21 - 06 - 2017, 04:15 PM
Real Estate (DJUSRE): Buy now or Wait?

We track a lot of Indices around the World. One of the Indices we track is DJUSRE (Dow Jones US Real Estate Index) which provides a guideline for housing properties in the U.S. Buying real estate is always a good way to invest and make money. For years, investors use the real estate sector as one avenue of investment. There is an aspect which many people miss which is the timing. During the 2002-2006 period, prices of properties skyrocketed around the world and many people were able to make a quick profit and cash thousands of dollars out of the investment.

However, there were also many people who got trapped at the top and defaulted on the home loan because of the rapid decline in value and the obligation to the bank. When it comes to real estate, timing is everything and the method of buying also plays a role. There are two ways to buy properties, either using cash or bank’s mortgage. The difference between the two is the interest on the loan, either with a higher monthly payment or with an early penalty that can cost thousands of dollars.

The worst case scenario for an investor is buying at the peak using bank’s loan. During the 2008 – 2009 credit crisis, a lot of home owners owe the bank more than the value of their homes as prices collapse driven by speculative buildup of houses and subprime mortgage. If we drove around in 2010, we were able to see a lot of empty houses and buildings. Most of the buildings belong either to banks or associations.

DJUSRE (Dow Jones US Real Estate) Long Term Chart


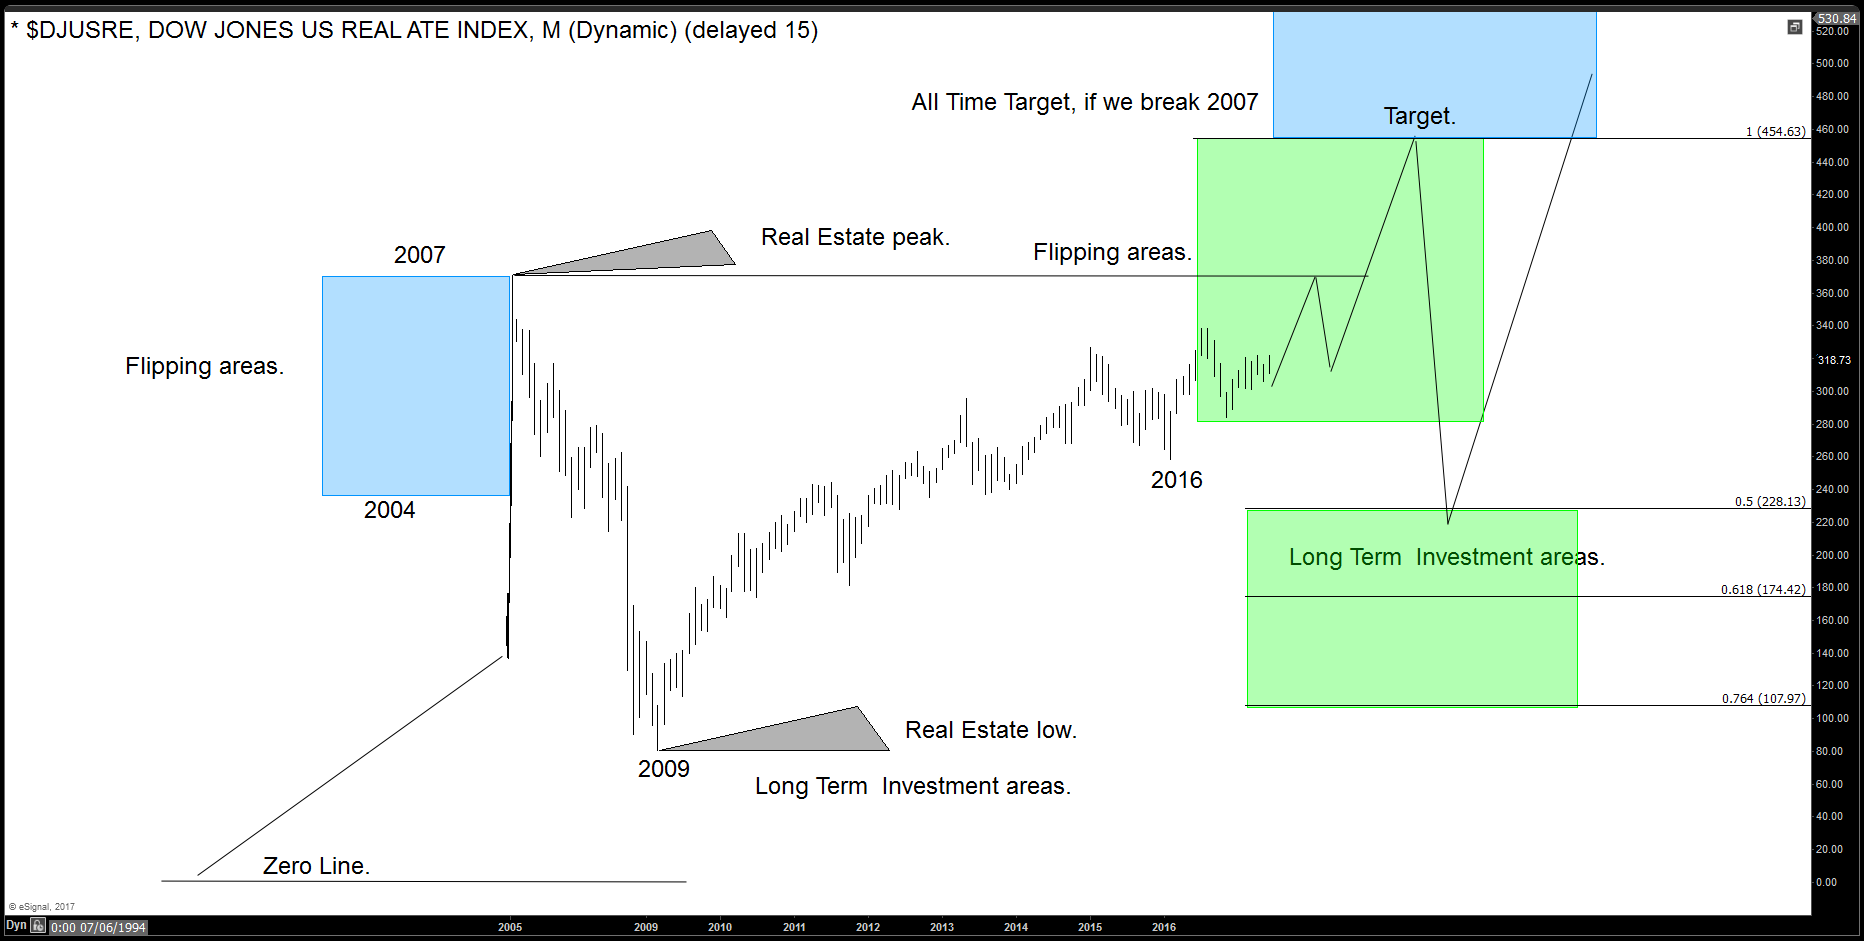
Looking at DJUSRE chart above, current real estate price is around the price in 2004-2005. When buying real estate you can do it for a flip or a long term investment. For a flip means that the investor will bet in a fast increase in value and then sell the property for a quick cash. Timing will play a big role when buying for a quick gain as it needs to be done at the proper time. Improper timing can leave investors with a bad investment or like many like to call under the water.

Listening and looking around we can see an increase in TV advertisement on real estate promoting real estate company and sites. These are warning that the crowd has started again to buy properties. Even when the housing boom can last for another couple of years, we can be entering soon into areas when a biggest correction can happen. The increase in advertisement as well as the signs on the streets which is a reflection of the crowd environment is calling for the top to be forming soon.

When looking at DJUSRE Index chart above, if it manages to break above 2007 peak, it’s possible to reach 454 level. This level is when the rally since all-time lows to 2007 will equal to the rally from 2009. When looking at other indices around the world, we believe this could be the scenario in real estate market. When DJUSRE Index breaks above 2007 level, it will drive properties even to new all-time highs, but investors need to know that if they want to buy home now, it is for a quick gain (flip) and not for long Investment.

We need to understand the differences between the two and invest accordingly, otherwise we can get caught in the wrong side. The real estate correction which should happen around the year of 2020 should be bigger than the correction in 2008 and consequently the damage can be even worse. We recommend investors who want long term investment to wait. Regular buyers need to understand that property will revisit these 2009-2010 levels again sometimes in the future so do get any cash out of the property so not to be under the water.

The path we expect for Dow Jones US Real Estate Index is a path to 367 then a turn lower to 320 before last push higher to 454. The Index should then see a huge correction and prices could drop to the levels of 2010 again around 160 when huge buying chances will happen. In reality, Market has two sides and many people who bought in 2009-2010 lows as investment will be selling soon and the market will switch from buyers’ market to sellers’ market again and follow the cycles of the Market.

Understanding the timing is key to enter the real estate market. Current situation is similar to the year of 2004 and the market has 3 or more years to rally when flippers will be able to cash some money. The closer we get to 454 or the year 2020, the danger will increase. Buy now if you a Flipper and wait if you are a long term investor, because there will be a better chance down the road.
Ayoub Ben Rejeb غير متواجد حالياً  
رد مع اقتباس
عضو نشيط
 
تاريخ التسجيل: Dec 2013
الدولة: Tunisia
المشاركات: 282
خبرة السوق: أكثر من 5 سنوات
معدل تقييم المستوى: 13
Ayoub Ben Rejeb is on a distinguished road
افتراضي رد: Elliott Wave Analysis by EWF
113#
21 - 06 - 2017, 04:26 PM
Palladium XPDUSD Elliott Wave Impulse

In our previous article, we talked about the Bullish Palladium XPDUSD which is supporting the commodity market for another leg to the upside. To be able to join for the move higher, we need to identify the potential scenarios and look for the next inflection areas using our Elliott Wave Theory charts.

XPDUSD Elliott Wave View
The move from January 2016 low is advancing in a series of 5 waves forming higher highs & higher lows and has a high probability of completing an impulse move as it keeps extending higher. So technically the metal should trade within the bullish channel and see higher levels around $970 – $1080.


On Friday June 9, XPDUSD reached equal legs area $900 from January 2016 low and already reacted lower from there ending the cycle from 05/22 low. The metal did 3 waves from the peak which could be enough to resume higher , but if we correlate the move with the rest of commodities then while it’s holding below the peak it can still make another leg lower toward the 50% – 76.4% area $830 – $787 before another bounce higher is seen as long as pivot at 752 low keeps holding.


If XPDUSD mange to break below $752, then most likely it will end the cycle from January 2016 low as a double three structure and will do a deeper correction that can reach the 50% retracement around $680 before it resumes the move to the upside.


Recap
Palladium is currently the strongest performing metal and having a monthly bullish sequence is clearly sending a warning message for commodity bears So it’s not a wise choice to look for the short side at current stage and it’s better to trade the clearest structure among the the strongest instruments.
Ayoub Ben Rejeb غير متواجد حالياً  
رد مع اقتباس
عضو نشيط
 
تاريخ التسجيل: Dec 2013
الدولة: Tunisia
المشاركات: 282
خبرة السوق: أكثر من 5 سنوات
معدل تقييم المستوى: 13
Ayoub Ben Rejeb is on a distinguished road
افتراضي رد: Elliott Wave Analysis by EWF
114#
21 - 06 - 2017, 05:18 PM
NZDUSD : Wait for Pullback then Buy Again

NZDUSD is showing 2 bullish patterns on the daily chart so we are expecting for the pair to continue higher. A move lower will now give bulls a chance to push the pair higher. Below we will show the possible bullish scenarios where bulls can enter the market and catch the move higher.

NZDUSD Daily Chart 2 Possible Bullish Patterns: Traders need to wait for NZDUSD to terminate red point C between the red AB 1.618% – AB 2.24% Fib. levels. A move lower from the suggested area to the red BC 0.50% Fib. retracement level will trigger BUYS. As long as price stays above the red point B low, watch for NZDUSD to make another swing higher. There is also strong support/resistance at the red BC 0.50% area which will allow a possible bounce higher. Watch for move higher towards the blue AB 2.24% Fib. level.


If looking to buy NZDUSD we prefer waiting for a retracement/pullback to trigger the red point D sell at the BC 0.50%. Stops should be placed at 0.6816 (point red B low) and should be bought at the BC 0.50% Fib. level minimum for a better risk/reward trade with targets above the blue AB 2.24% Fib. level.

Of course, like any strategy/technique, there will be times when the strategy/technique fails so proper money/risk management should always be used on every trade.
Ayoub Ben Rejeb غير متواجد حالياً  
رد مع اقتباس
عضو نشيط
 
تاريخ التسجيل: Dec 2013
الدولة: Tunisia
المشاركات: 282
خبرة السوق: أكثر من 5 سنوات
معدل تقييم المستوى: 13
Ayoub Ben Rejeb is on a distinguished road
افتراضي رد: Elliott Wave Analysis by EWF
115#
21 - 06 - 2017, 05:59 PM
[LEFT]TASI TADAWUL breaks above Jan 2017 after prolong sideways consolidation. Currently up +7% from our weekend updated.

Ayoub Ben Rejeb غير متواجد حالياً  
رد مع اقتباس
عضو نشيط
 
تاريخ التسجيل: Dec 2013
الدولة: Tunisia
المشاركات: 282
خبرة السوق: أكثر من 5 سنوات
معدل تقييم المستوى: 13
Ayoub Ben Rejeb is on a distinguished road
افتراضي رد: Elliott Wave Analysis by EWF
116#
21 - 06 - 2017, 06:37 PM
XAUAUD Mid-term Elliott Wave Analysis

Back in November 2016, we mentioned that Gold should find buyers in 1540 – 1487 area and bounce ideally to resume the rally for new highs or in 3 waves at least. 3 weeks later, XAUAUD reached the mentioned area, it then found a low at 1525 on 12/15/2016 and started rallying. Yellow metal has reached 61.8 Fibonacci retracement (1728) of the drop from June 2016 peak and longs from 1540 should be risk free already. Today, we will take a look at the price action from 12/15/2016 low and the current forecast.

XAUAUD Weekly Elliott Wave View
Bigger picture in Gold-AUD remains unchanged. It’s showing 5 swings up from 2008 low which means the sequence is incomplete and calls for extension higher towards 2220 – 2441 area. Pull back in wave “x” reached 50% of wave “w” and is proposed completed at 1525. As dips hold above this level, rally is expected to continue towards 2220 – 2241 area. If pivot at 1525 low gives up during the current pull back, wave “x” could turn into a double three correction towards 1417 area but it should still remain bullish against 1280.52 low. This alternate view is less likely and should only be considered if the pivot or the low at 1525 breaks.


XAUAUD Elliott Wave Diagonal in wave (A)
Yellow metal has ended the cycle from 12/15/2016 (1525) low at 1727.59. Move up from 1525 low could be viewed as an Elliott Wave Diagonal structure i.e wave (A). A pull back in wave (B) should unfold in 3, 7 or 11 swings and hold above 1525 low for extension higher. 1626 – 1602 is 50 – 61.8 Fibonacci retracement area of wave (A) and could complete all of wave (B) or ideally complete just wave W of (B) which would be followed by a bounce in wave X and another push lower to complete wave (B). GCC (Wisdom Tree Commodity Index Fund) Elliott wave structure and sequences supports the idea of a double three correction in wave (B). We don’t like selling the yellow metal and expect dips to remain supported in 3, 7 or 11 swings as far as pivot at 1525 low remains intact.


XAUAUD FLAT in wave (X)
If the cycle from 6/6/2017 (1727.59) extends then, we could consider cycle from 12/15/2016 low to be over at 4/18/2017 (1712.75) i.e. wave (W) followed by a FLAT in wave (X) which should still end between 1618 – 1568 area and then we can see the yellow metal resuming the rally or making a larger 3 waves bounce at least.

Ayoub Ben Rejeb غير متواجد حالياً  
رد مع اقتباس
عضو نشيط
 
تاريخ التسجيل: Dec 2013
الدولة: Tunisia
المشاركات: 282
خبرة السوق: أكثر من 5 سنوات
معدل تقييم المستوى: 13
Ayoub Ben Rejeb is on a distinguished road
افتراضي رد: Elliott Wave Analysis by EWF
117#
22 - 06 - 2017, 12:55 PM
DAX Elliott Wave Analysis: Pullback Completed

Short term DAX Elliott Wave view suggests the rally from 5/18 is unfolding as a double three Elliott Wave structure. Minute wave ((w)) ended at 12879.5 and Minute wave ((x)) pullback ended at 12617. Internal of Minute wave ((x)) subdivided as an expanded flat Elliott Wave structure where Minutte wave (a) ended at 12633.5, Minutte wave (b) ended at 12922.5 and Minutte wave (c) of ((x)) ended at 12617. DAX has broken above Minutte wave (b) on 6/14, adding conviction that the next leg higher has started. Up from 12617, the rally is unfolding as a zigzag Elliott Wave structure where Minutte wave (a) ended at 12948.5 and Minutte wave (b) is proposed complete at 12701.5. Near term, while pullbacks stay above 12701.5, and more importantly above 12617, expect Index to extend higher. We do not like selling the Index.

DAX 1 Hour Elliott Wave Chart

Ayoub Ben Rejeb غير متواجد حالياً  
رد مع اقتباس
عضو نشيط
 
تاريخ التسجيل: Dec 2013
الدولة: Tunisia
المشاركات: 282
خبرة السوق: أكثر من 5 سنوات
معدل تقييم المستوى: 13
Ayoub Ben Rejeb is on a distinguished road
افتراضي رد: Elliott Wave Analysis by EWF
118#
23 - 06 - 2017, 01:42 PM
DAX Elliott Wave Analysis: Rally expected

Short term DAX Elliott Wave view suggests the rally from 5/18 is unfolding as a double three Elliott Wave structure. Minute wave ((w)) ended at 12879.5 and Minute wave ((x)) pullback ended at 12617. Internal of Minute wave ((x)) subdivided as an expanded flat Elliott Wave structure where Minutte wave (a) ended at 12633.5, Minutte wave (b) ended at 12922.5 and Minutte wave (c) of ((x)) ended at 12617. DAX has broken above Minutte wave (b) on 6/14, adding conviction that the next leg higher has started. Up from 12617, the rally is unfolding as a zigzag Elliott Wave structure where Minutte wave (a) ended at 12948.5 and Minutte wave (b) is proposed complete at 12701.5. Near term, while pullbacks stay above 12701.5, and more importantly above 12617, expect Index to extend higher. We do not like selling the Index.

DAX 1 Hour Elliott Wave Chart 06/23/2017


Ayoub Ben Rejeb غير متواجد حالياً  
رد مع اقتباس
عضو نشيط
 
تاريخ التسجيل: Dec 2013
الدولة: Tunisia
المشاركات: 282
خبرة السوق: أكثر من 5 سنوات
معدل تقييم المستوى: 13
Ayoub Ben Rejeb is on a distinguished road
افتراضي رد: Elliott Wave Analysis by EWF
119#
23 - 06 - 2017, 03:52 PM
DJI Futures Elliott Wave Analysis: Pull back in progress

Short term YM (DJI Futures) Elliott Wave view suggests the rally from 4/19 low is unfolding as a diagonal Elliott Wave structure where Minor wave 1 ended at 21010 (4/26), Minor wave 2 ended at 20474 (5/18), Minor wave 3 ended at 21494 (6/19). Minor wave 4 is in progress and subdivided into a double three Elliott Wave structure. Down from 6/19 peak, Minor wave 4 is expected to do 7 swings and reach 21257 – 21221 area. Index should then resume the rally looking for new highs or bounce in 3 waves at least. We don’t like selling the proposed pullback and expect buyers to keep appearing at extremes in the sequence of 7 or 11 swings as far as pivot at 5/18 (20474) low remains intact in the first degree and 4/19 (20311) low remains intact in the second degree.

YM (DJI Mini Futures) 1 Hour Elliott Wave Chart 06/23/2017

Ayoub Ben Rejeb غير متواجد حالياً  
رد مع اقتباس
عضو نشيط
 
تاريخ التسجيل: Dec 2013
الدولة: Tunisia
المشاركات: 282
خبرة السوق: أكثر من 5 سنوات
معدل تقييم المستوى: 13
Ayoub Ben Rejeb is on a distinguished road
افتراضي رد: Elliott Wave Analysis by EWF
120#
27 - 06 - 2017, 02:44 PM
EURJPY Elliott Wave Analysis: Bullish against 123.6

Short term EURJPY Elliott Wave view suggests the decline to 122.35 on 6/15 low ended Intermediate wave (X). Rally from there is unfolding as a double three Elliott Wave structure where Minute wave ((w)) ended at 124.46 and Minute wave ((x)) ended at 123.62. Minute wave ((y)) is in progress and also unfolding as a double three. Near term focus is on 125.42 – 125.68 to complete Minutte wave (w) of ((y)). Afterwards, pair should pullback in Minutte wave (x) of ((y)) in 3, 7, or 11 swing before turning higher again, provided pivot at 123.6 low stays intact. We don’t like selling the pair.

EURJPY 1 Hour Elliott Wave Chart

Ayoub Ben Rejeb غير متواجد حالياً  
رد مع اقتباس


إضافة رد

الكلمات الدلالية (Tags)
commodity, elliott wave, forex, stocks


جديد مواضيع منتدى تداول العملات العام

المواضيع المتشابهه
الموضوع كاتب الموضوع المنتدى مشاركات آخر مشاركة
elliott wave Nnana123 منتدى تداول العملات العام 6 11 - 04 - 2015 07:07 PM


11:18 AM