• 4:00 مساءاً


Elliott Wave Analysis by EWF

إضافة رد
Like Tree17Likes

أدوات الموضوع
عضو نشيط
 
تاريخ التسجيل: Dec 2013
الدولة: Tunisia
المشاركات: 282
خبرة السوق: أكثر من 5 سنوات
معدل تقييم المستوى: 13
Ayoub Ben Rejeb is on a distinguished road
افتراضي رد: Elliott Wave Analysis by EWF
71#
24 - 05 - 2017, 02:14 PM
Randgold Resources Short Term Bullish Sequence

Randgold Resources (NASDAQ: GOLD) was founded 22 years ago in 1995, it’s a gold mining business operating in Africa mainly in Mali. The price of Gold & Silver dropped significantly early this month which put a lot of pressure on mining stocks but Rangold was one of the strongest and managed to rally %14 to make new 2017 high. Let’s take a look at the technical chart to identify the potential path.


Since the September 2015 low, GOLD rallied in 5 waves diagonal structure then topped in July 2016 like the precious metals. The stock corrected that rally in a double three structure which reached the equal legs area $72.51 – $64.62 and ended the 7th swing lower. So it held above 2015 low ($54) and bounced from the inflection area to create a higher low sequence supporting the idea of GOLD resuming the rally to the upside.

The Elliott Wave structure can be labeled in different ways depending on how the move will develop and the current most aggressive view would be another 5 waves from December 2016 low with the first wave already in place . Consequently as the stock already made new high last week then it’s now showing an incomplete bullish sequence from the lows that would at least take the stock higher toward equal legs area $110.75 – $117.28. So currently the pullback that should happen from inflection area $98.16-$95.37 needs to hold above March low and buyers needs to step up for the rally to resume higher. The alternative view in case the pivot at March low breaks then GOLD would be doing a flat structure from February peak and still in wave (2) which should ideally hold above $67.54 low to maintain the bullish view.

The short term path can be adjusted according to new price action but while pivot at December 2016 low is intact then the stock should extend higher to reach the equal legs area around $140 from 2015 low. That move can be counted as a simple Zigzag structure and take some time before it happens but it can also be a part of a new impulse sequence and accelerate to the upside.

Randgold Recap

The overall picture for the mining company is suggesting more gains to be seen in the future that could take Rangold stock toward $110 as a first step before breaking to new all time highs targeting $140. The move will be supported by a recovery in the precious metals and using Gold to Silver Ratio could be a good proxy to identify the right timing to start the next leg higher.
Ayoub Ben Rejeb غير متواجد حالياً  
رد مع اقتباس

عضو نشيط
 
تاريخ التسجيل: Dec 2013
الدولة: Tunisia
المشاركات: 282
خبرة السوق: أكثر من 5 سنوات
معدل تقييم المستوى: 13
Ayoub Ben Rejeb is on a distinguished road
افتراضي رد: Elliott Wave Analysis by EWF
72#
25 - 05 - 2017, 03:04 PM
ES_F Index Elliott Wave: Resuming Higher

Short Term Elliott Wave view in ES_F Index suggests the rally to 2403.75 ended Minor wave A. Minor wave B unfolded as an Expanded Flat Elliott Wave structure where Minute wave ((a)) ended at 2379, Minute wave ((b)) ended at 2404.5, and Minute wave ((c)) of B ended at 2344.5. After ending the pullback, the Index started a new leg higher and the rally from 2344.5 low looks to be unfolding as a 5 waves Elliott Wave impulse structure where Minutte wave (i) ended at 2375, Minutte wave (ii) ended at 2361, and Minutte wave (iii) is proposed complete at 2411.25. Expect Minutte wave (iv) pullback to commence soon to correct cycle from 5/19 low before turning higher one more time to end Minutte wave (v). This last push higher will also complete larger degree Minute wave ((i)).

Once Minute wave ((i)) is complete, the Index should pullback within Minute wave ((ii)) in 3, 7, or 11 swing to correct cycle from 5/18 low (2344.7) before the rally resumes again. As the Index has broken above the previous peak at 2404.5, it gives more conviction that the Index has started the next leg higher and thus pullback can likely hold above 2344.7 for more upside. We don’t like selling the proposed pullback and expect buyers to appear again once Minute wave ((ii)) pullback is complete at later stage, provided that pivot at 2344.7 low remains intact.

[عذراً, فقط الأعضاء يمكنهم مشاهدة الروابط ]


Ayoub Ben Rejeb غير متواجد حالياً  
رد مع اقتباس
عضو نشيط
 
تاريخ التسجيل: Dec 2013
الدولة: Tunisia
المشاركات: 282
خبرة السوق: أكثر من 5 سنوات
معدل تقييم المستوى: 13
Ayoub Ben Rejeb is on a distinguished road
افتراضي رد: Elliott Wave Analysis by EWF
73#
26 - 05 - 2017, 03:28 PM
ES_F E-Mini S&P500 Elliott Wave: Ending wave (iii)

Short Term Elliott Wave view in ES_F E-Mini S&P500 suggests the rally to 2403.75 ended Minor wave A. Minor wave B unfolded as an Expanded Flat Elliott Wave structure where Minute wave ((a)) ended at 2379, Minute wave ((b)) ended at 2404.5, and Minute wave ((c)) of B ended at 2344.5. After ending the pullback, the Index started a new leg higher and the rally from 2344.5 low looks to be unfolding as a 5 waves Elliott Wave impulse structure where Minutte wave (i) ended at 2375, Minutte wave (ii) ended at 2361, and Minutte wave (iii) remains in progress and can reach 2423.13 or 161.8% fibonacci extension of Minutte wave (i). Expect Minutte wave (iv) pullback to start once Minutte wave (iii) is over before turning higher one more leg in Minutte wave (v). This last push higher will also complete larger degree Minute wave ((i)) and as impulse, it should be accompanied with momentum divergence.

Once Minute wave ((i)) is complete, the Index should pullback within Minute wave ((ii)) in 3, 7, or 11 swing to correct cycle from 5/18 low (2344.7) before the rally resumes again. As ES_F E-Mini S&P500 has broken above the previous peak at 2404.5, it gives more conviction that the Index has started the next leg higher and thus pullback can likely hold above 2344.7 for more upside. We don’t like selling the proposed pullback and expect buyers to appear again once Minute wave ((ii)) pullback is complete at later stage, provided that pivot at 2344.7 low remains intact.

ES_F E-Mini S&P500 1 Hour Elliott Wave Chart 05/26/017


Ayoub Ben Rejeb غير متواجد حالياً  
رد مع اقتباس
عضو نشيط
 
تاريخ التسجيل: Dec 2013
الدولة: Tunisia
المشاركات: 282
خبرة السوق: أكثر من 5 سنوات
معدل تقييم المستوى: 13
Ayoub Ben Rejeb is on a distinguished road
افتراضي رد: Elliott Wave Analysis by EWF
74#
31 - 05 - 2017, 12:36 PM
GBPJPY Elliott Wave: Downside Has Resumed

Short Term GBPJPY Elliott Wave view suggests the decline from 5/10 peak is unfolding as a double three Elliott Wave structure where Minor wave W ended at 143.33 and Minor wave X ended at 145.45. The subdivision of Minor wave W unfolded as a zigzag Elliott Wave structure where Minute wave ((a)) ended at 145.61, Minute wave ((b)) ended at 147.12, and Minute wave ((c)) of W ended at 143.33. After ending Minor wave X at 145.45, pair has since resumed lower and broken below 143.33. This creates a bearish 5 swing incomplete sequence from 5/10 peak and favors more downside in the near term.

GBPJPY Elliott Wave structure of the decline from 145.45 looks to be in a zigzag where Minute wave ((a)) ended at 142.11 and Minute wave ((b)) is proposed complete at 143.09 as a Flat Elliott Wave structure. Pair has broken below 141.81 irregular Minutte wave (b) which suggests that Minute wave ((c)) lower has already started. Near term, while bounces stay below 143.09 in the first degree, but more importantly below 5/25 high (145.45), expect pair to continue lower towards 139.51 – 140.65 area before cycle from 5/10 peak ends. Buyers should then appear from the aforementioned area for an extension higher or at least a 3 waves bounce. We do not like selling the proposed move to the downside.

GBPJPY Elliott Wave 1 Hour Chart 05/31/2017

[IMG]GBPJPY Elliott Wave: Downside Has Resumed Short Term GBPJPY Elliott Wave view suggests the decline from 5/10 peak is unfolding as a double three Elliott Wave structure where Minor wave W ended at 143.33 and Minor wave X ended at 145.45. The subdivision of Minor wave W unfolded as a zigzag Elliott Wave structure where Minute wave ((a)) ended at 145.61, Minute wave ((b)) ended at 147.12, and Minute wave ((c)) of W ended at 143.33. After ending Minor wave X at 145.45, pair has since resumed lower and broken below 143.33. This creates a bearish 5 swing incomplete sequence from 5/10 peak and favors more downside in the near term. GBPJPY Elliott Wave structure of the decline from 145.45 looks to be in a zigzag where Minute wave ((a)) ended at 142.11 and Minute wave ((b)) is proposed complete at 143.09 as a Flat Elliott Wave structure. Pair has broken below 141.81 irregular Minutte wave (b) which suggests that Minute wave ((c)) lower has already started. Near term, while bounces stay below 143.09 in the first degree, but more importantly below 5/25 high (145.45), expect pair to continue lower towards 139.51 – 140.65 area before cycle from 5/10 peak ends. Buyers should then appear from the aforementioned area for an extension higher or at least a 3 waves bounce. We do not like selling the proposed move to the downside. GBPJPY Elliott Wave 1 Hour Chart 05/31/2017 GBPJPY Elliott Wave View May 31[/IMG]
Ayoub Ben Rejeb غير متواجد حالياً  
رد مع اقتباس
عضو نشيط
 
تاريخ التسجيل: Dec 2013
الدولة: Tunisia
المشاركات: 282
خبرة السوق: أكثر من 5 سنوات
معدل تقييم المستوى: 13
Ayoub Ben Rejeb is on a distinguished road
افتراضي رد: Elliott Wave Analysis by EWF
75#
31 - 05 - 2017, 01:32 PM
Are the World Indexes close to a Huge peak?

Since the correction between the year 2000 and 2009, many traders around the world have developed an idea of bearish World Indexes with more downside to come. With Fed driving Market, everyone is under the idea that Global Indexes are inflated and will crash again resulting in another decline like the one seen in 2008. Traders, first of all, need to understand that the Market does not move in a straight line, it has never moved in a straight line and never will, consequently correction in different degrees always will take place. It is understandable that the biggest correction we have seen so far was the one that happened between 2000-2009 and someday a correction even bigger that that will happen. It is important to understand that corrections are needed, otherwise there would be no losers and no profit takers. We believe that the Indexes trend will always be Bullish in the Century and Yearly time frames and will do corrections in weekly, monthly and even yearly degree at one stage. We follow all Indexes around the World and apply a system in which we ride the trend is over and market said correction has started and then, we locate the degree and we adjust the counts according to the degrees. We use Elliott wave Theory to count the waves and gather directions, also to explain our ideas to members and followers, but we use several other tools like correlations, sequences, cycles, time and distribution to increase accuracy of our forecasts.

In 2015, we knew it was time for a correction in Daily Time frame and we warned members and followers about it. Read this blog $NIFTY reaching a Warning area for Indexes Bulls and see how the $NIFTY from India was the one that called the extreme in time and price and we knew that was the time for the World Indexes to make a daily correction and pull back in 3 swings at least or extend into 7 or 11 swings. However, at that moment, we also knew that the dip was another chance to buy into the all-time 100% in most World Indexes. Now the World Indexes are not yet at risk of another major peak and any dips should still be considered another chance to buy in 3, 7 or 11 swings.

FTSE Swing sequence from the All Time Low


Since the all-time low and following the sequences in 3 different degrees Black/ BLUE /RED, it is clear that Price has not yet reached the 100% Fibonacci extension area between 9109-10000 area and neither time has matched the 1=3 in RED degree, nor 1 Blue = 3 Blue within RED 3. the idea is that soon, market will pull back in 2 BLACK within 3 Blue but still both price and time are calling for stronger Indexes into the years 2022-25 and that’s when there would be a chance of a nice correction either to correct the cycle from 2009 low i.e. 3 RED or the whole cycle since 0 RED. By then, we will get a perfect hit of 3-3-3 and the Index should be ready for at least a Weekly correction. As we mentioned earlier, a big Illusion has been created that a huge Crash needs to happen in the World Indexes but the Reality is that someday a big correction will happen, but picking tops against a clear Bullish trend it is not the right trade. In 2022 the time will be equal from 2009-2015 and 2016 to 2022 which will be equal cycles of 6 years and also if price has reached the 1=3 RED and then 1=3 in BLUE, there will be chance of weekly correction to take place in the World Indexes, until then our strategy remains to buy the dips in 3, 7 or 11 swings and not pick the tops.
Ayoub Ben Rejeb غير متواجد حالياً  
رد مع اقتباس
عضو نشيط
 
تاريخ التسجيل: Dec 2013
الدولة: Tunisia
المشاركات: 282
خبرة السوق: أكثر من 5 سنوات
معدل تقييم المستوى: 13
Ayoub Ben Rejeb is on a distinguished road
افتراضي رد: Elliott Wave Analysis by EWF
76#
31 - 05 - 2017, 01:47 PM
AUDNZD Possible Bounce Higher?

AUDNZD since March 13/2017 has been moving lower. There are possible bullish patterns that can push the pair higher but traders need to see AUDNZD price action slow down and show possible signs that it wants to reverse and bounce higher.

AUDNZD 4 hour Elliott Wave Analysis May 29/2017 : The pair can find support at the inflection zone (Blue box) where wave ((X)) can terminate and possibly bounce higher.


AUDNZD Daily Bullish Pattern #1 : Bullish pattern triggers BUYS at the XA 0.886% Fib. level coinciding with the above inflection zone (blue box). Only a break below point X of the blue pattern will invalidate the bullish pattern.


AUDNZD Daily Bullish Pattern #2 : There is also a possibility of AUDNZD not pushing lower and reversing higher from current levels. A bullish AB=CD pattern has already been triggered at the 1.0% Fib. extension level. As long as price stays above 1.0323 AUDNZD can bounce higher.


If looking to buy AUDNZD we prefer the blue bullish pattern #1 setup. Stops should be placed at 1.0323 (point blue X low) and should be bought at the XA 0.886% Fib. level (1.0402) minimum for a better risk/reward trade with targets above the point A high of the blue pattern #1.

Of course, like any strategy/technique, there will be times when the strategy/technique fails so proper money/risk management should always be used on every trade.
Ayoub Ben Rejeb غير متواجد حالياً  
رد مع اقتباس
عضو نشيط
 
تاريخ التسجيل: Dec 2013
الدولة: Tunisia
المشاركات: 282
خبرة السوق: أكثر من 5 سنوات
معدل تقييم المستوى: 13
Ayoub Ben Rejeb is on a distinguished road
افتراضي رد: Elliott Wave Analysis by EWF
77#
01 - 06 - 2017, 03:18 PM
EURJPY Elliott Wave: Bullish against May 30th low

Short Term EURJPY Elliott Wave view suggests the rally from 4/16 low is unfolding as a double three Elliott Wave structure. Up from 4/16 (114.8) low, Intermediate wave (W) ended at 125.81 and Intermediate wave (X) ended at 122.53. A break above 125.81 however is still needed to add conviction that the next leg higher has started.

From 122.53 low, the rally is also unfolding as a double three Elliott Wave structure. Minute wave ((w)) ended at 125.8 and Minute wave ((x)) ended at 123.11. Near term, while pullbacks stay above 123.11, expect pair to extend higher. If pair breaks below 123.11, then pair is likely doing a double correction from 5/16 peak. This suggests pair can open extension lower to 121.6 – 122.25 area in case of a double correction. From this area, buyers should appear again for an extension higher or at least a 3 waves bounce. We do not like selling the proposed move to the downside and expect dips to find buyers in 3, 7, or 11 swing.

EURJPY 1 Hour Elliott Wave Chart 06/01/2017


Ayoub Ben Rejeb غير متواجد حالياً  
رد مع اقتباس
عضو نشيط
 
تاريخ التسجيل: Dec 2013
الدولة: Tunisia
المشاركات: 282
خبرة السوق: أكثر من 5 سنوات
معدل تقييم المستوى: 13
Ayoub Ben Rejeb is on a distinguished road
افتراضي رد: Elliott Wave Analysis by EWF
78#
01 - 06 - 2017, 03:39 PM
OPEC Meeting and Impact on Crude Oil

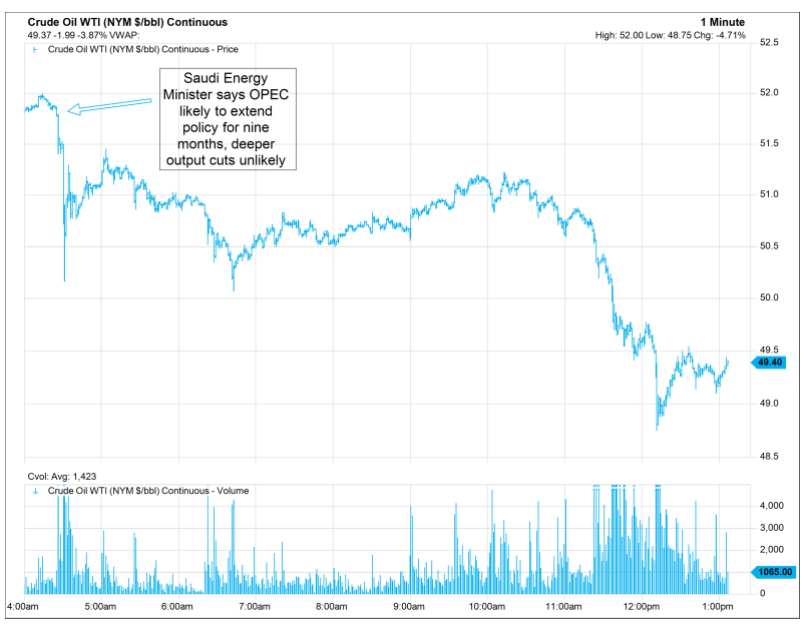
OPEC ended its highly anticipated meeting on Vienna last Thursday to discuss about extending the production cut in Crude Oil. They have decided to extend the current agreement to cut production output by 1.8 million barrels per day by 9 more months to stabilize oil price. Oil prices plunged by more than 5 percent after the decision.


Source: CNBC

Prior to the meeting, almost all of the oil ministers from OPEC and Non OPEC participants have suggested a 9-month production cut extension. This means that the production cut will run until March 2018. Saudi Arabia and Russia have both verbally consented to the extension even before the meeting began. Since they represent the biggest OPEC and Non-OPEC member, this outcome has largely been priced in by the market.

However, market was anticipating further surprise from the meeting such as a deeper and more aggressive production cut. Investors had hoped for further output cut to drain the global glut which depressed oil’s price for almost three years. As the decision outcome only meets the market expectation, disappointed investors ran for an exit following the meeting.

Despite the short term knee-jerk reaction, typical of “buy rumors, sell the facts”, the outlook on Oil prices remain constructive in longer term. The production cuts should help accelerate inventories draw down for the remainder of the year and could set a new floor for Crude Oil price. OPEC also discussed extending the production cuts through June 2018 if the price of Oil keeps falling. Their decision will be reviewed near the end of the nine-month extension.

The Joint Ministerial Monitoring Committee (JMMC) which was established last December to watch the compliance of the production cut, said that OPEC and NOPEC compliance exceeded expectation at 102%. Saudi Arabia has cut production by 553,000 barrels per day, which is 14% higher than their commitment. Due to the budget deficit, Saudi Arabia as the largest member appears committed to stabilizing Oil price. This is contrary to their previous strategy of flooding the market with Oil to drive out U.S. shale companies. With OPEC members determined to support Oil’s price, a higher price floor above Feb 2016 low ($26.05) has likely been established. There are two possible buying areas for Crude Oil’s dip buyers.

Crude Oil Bullish Scenario #1


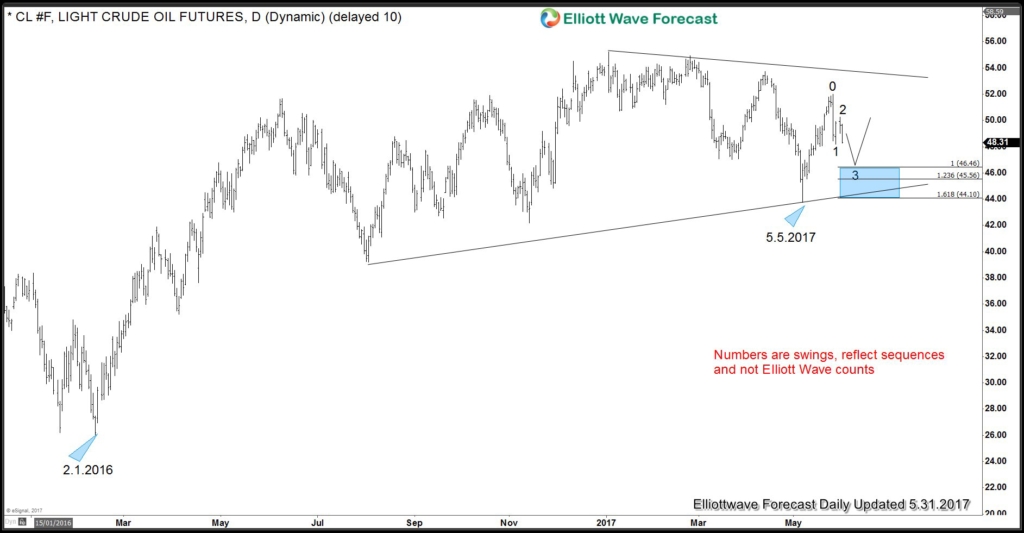
In the first scenario above, Crude Oil is doing a symmetrical triangle consolidation since June 2016. It is bullish against 5.5.2017 low ($43.76) in the first degree. If pivot at $43.76 holds, then buyers may appear after 3 swing pullback at 45.56 – 46.46 area for an extension higher or a 3 waves bounce.

Crude Oil Bullish Scenario #2


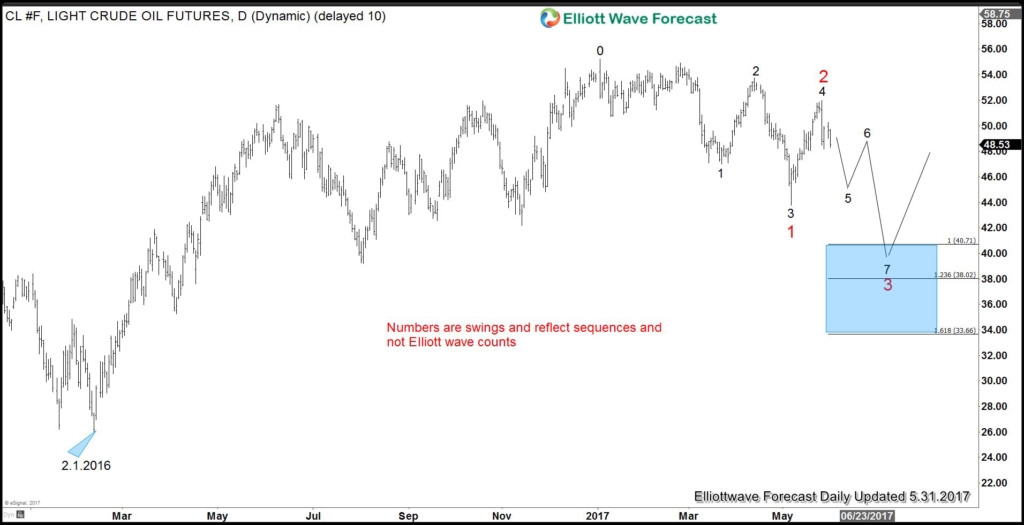
In the second scenario above, Crude Oil is correcting the entire cycle from 2.1.2016. This correction should unfold in 7 swing and become the next option if pivot at 5.5.2017 low ($43.76) fails. The next buying area in the 7th swing extreme area is at 38.02 – 40.71. Buyers should appear in this area for either a new high or at least a 3 waves bounce.

As the market is dynamic, traders need to keep up with the most up-to-date analysis of their favorite instrument. Successful traders need to have a good trading system and also strict risk management with rules that define entry, stop loss, and take profit levels with high accuracy to allow traders to get into a risk free position in your trade as quickly as possible
Ayoub Ben Rejeb غير متواجد حالياً  
رد مع اقتباس
عضو نشيط
 
تاريخ التسجيل: Dec 2013
الدولة: Tunisia
المشاركات: 282
خبرة السوق: أكثر من 5 سنوات
معدل تقييم المستوى: 13
Ayoub Ben Rejeb is on a distinguished road
افتراضي رد: Elliott Wave Analysis by EWF
79#
02 - 06 - 2017, 01:09 PM
EURJPY Elliott Wave: Short term Pullback

Short Term EURJPY Elliott Wave view suggests the rally from 4/16 low is unfolding as a double three Elliott Wave structure. Up from 4/16 (114.8) low, Intermediate wave (W) ended at 125.81 and Intermediate wave (X) ended at 122.53. A break above 125.81 however is still needed to add conviction that the next leg higher has started.

From 122.53 low, the rally is also unfolding as a double three Elliott Wave structure. Minute wave ((w)) ended at 125.8 and Minute wave ((x)) ended at 123.11. Near term, cycle from 5/30 low (123.11) is mature and expected to end soon. This cycle from 5/30 low is unfolding as a Flat Elliott Wave structure and expected to end with Minutte wave (w) at 125.5 – 125.7 area. Once Minutte wave (w) is over, expect pair to pullback in Minutte wave (x). The pullback should unfold in 3, 7, or 11 swing and while the pullback stays above 123.11, pair should extend higher. If pair breaks below 123.11, then pair is likely doing a double correction from 5/16 peak. This suggests pair can open extension lower to 121.6 – 122.25 area in case of a double correction. From this area, buyers should appear again for an extension higher or at least a 3 waves bounce. We do not like selling the proposed move to the downside and expect dips to find buyers in 3, 7, or 11 swing.

EURJPY Elliott Wave 1 Hour Chart 06/02/2017


Ayoub Ben Rejeb غير متواجد حالياً  
رد مع اقتباس
عضو نشيط
 
تاريخ التسجيل: Dec 2013
الدولة: Tunisia
المشاركات: 282
خبرة السوق: أكثر من 5 سنوات
معدل تقييم المستوى: 13
Ayoub Ben Rejeb is on a distinguished road
افتراضي رد: Elliott Wave Analysis by EWF
80#
02 - 06 - 2017, 06:54 PM
Ethereum showing Elliott Wave path for Bitcoin

Ethereum is an open-source blockchain-based distributed computing platform featuring smart contract functionality. It provides a decentralized Turing-complete virtual machine, the Ethereum Virtual Machine (EVM), which can execute scripts using an international network of public nodes. Ethereum also provides a crypto-currency token called “ether”, which can be transferred between accounts and used to compensate participant nodes for computations performed.

Ethereum went live in 2015, it quickly gained attraction in the digital world and it’s currently the second largest Crypto-Currency with 20 Billion Dollar in market cap surpassing Ripple (11 Billion) and sitting behind the Bitcoin (39 Billion). Since the start of 2017 , all the digital currencies doubled its value after after prices kept rising higher in the recent months and buyers all over the world jumping in to take a piece of the rally.

Looking at the some daily charts of the digital coins, you’ll probably see a parabolic curve to the upside which may seems hard to catch any trade. However using our swing sequences and following the trend which is clearly bullish as the instrument keeps making higher highs then buying the pullbacks in 3 , 7 or 11 swing was the right way to catch every dip during the recent rally.
Let’s take a look at the lower time frame chart of Ethereum and Bitcoin and explore the potential scenarios.

Ethereum: ETHUSD 4H Chart 05/31/2017


Ethereum saw a 50% decline from 05/25/2017 peak which may caused a lot of fear around the market, but looking at the technical picture the correction came after a 5 waves move from the lows and that why it was another great opportunity to buy ETHUSD after 3 waves zigzag pullback into the equal legs area 136 – 104. The instrument already rallied from the inflection area and managed to make a new all time highs opening a new extension to the upside toward ideally 315 – 365 area. In the shorter term, a pullback from 225 – 250 can be seen against 110 low but it can be just a shallow 3 waves pullback before Ethereum resumes the rally again as it has an incomplete bullish sequence.

BITCOIN: BTCUSD 1H Chart 05/31/2017


The same thing happened for Bitcoin which saw a 65% correction from 05/25 peak which unfolded as a double three structure and managed to finish the 7th swing around the equal legs area 2055 – 1720. The reaction from that area wasn’t strong enough to break to new high like the case of Ethereum but BTCUSD created a short term incomplete bullish sequence from 05/27 low which could take it toward equal legs area 2652 – 2771 before another pullback is seen. Bitcoin still needs to break the previous peak to open a new extension highs that can take it another $1000 higher. However if it fails to make new highs then there is still the possibility for a double correction which will represent another opportunity to buy it again.

Recap
Ethereum is the one leading the move for the rest of crypto-currencies as ETHUSD already made new all time highs and opened the door for another leg to the upside, which means Bitcoin should ideally follow the same path even it’s currently still lagging the equivalent move.

Buying crypto-currencies is the hot theme for 2017, investors has already added different types of digital coins to their portfolio and traders are trying to catch the long side of the rally. However there is huge volatility with these kind of instrument which causes sharp declines in few hours that can trick short term traders and may cause a lot of problem. That’s why unless you are owning these crypto-currencies from lower levels and looking to hold it for a long time then it’s better to pay attention to the market structure and learn how identify the right sequence and cycle to allow you to buy it the right area to protect you trade after the first reaction.
Ayoub Ben Rejeb غير متواجد حالياً  
رد مع اقتباس


إضافة رد

الكلمات الدلالية (Tags)
commodity, elliott wave, forex, stocks


جديد مواضيع منتدى تداول العملات العام

المواضيع المتشابهه
الموضوع كاتب الموضوع المنتدى مشاركات آخر مشاركة
elliott wave Nnana123 منتدى تداول العملات العام 6 11 - 04 - 2015 07:07 PM


04:00 PM