• 12:08 مساءاً


Elliott Wave Analysis by EWF

إضافة رد
Like Tree17Likes

عضو فـضـي
 
تاريخ التسجيل: Jul 2010
المشاركات: 3,680
معدل تقييم المستوى: 19
THE-ZERO is on a distinguished road
افتراضي رد: Elliott Wave Analysis by EWF
91#
13 - 06 - 2017, 01:52 PM
I will appreciate if you show us your view for the AUDNZD & EURJPY
THE-ZERO غير متواجد حالياً  
رد مع اقتباس

عضو نشيط
 
تاريخ التسجيل: Dec 2013
الدولة: Tunisia
المشاركات: 282
خبرة السوق: أكثر من 5 سنوات
معدل تقييم المستوى: 13
Ayoub Ben Rejeb is on a distinguished road
افتراضي رد: Elliott Wave Analysis by EWF
92#
13 - 06 - 2017, 02:37 PM
اقتباس:
المشاركة الأصلية كتبت بواسطة THE-ZERO مشاهدة المشاركة
Is there any update regarding this pair ??


NZDUSD made new high above 0.7228 and showing 3 waves from yesterday's low so it's needs a new leg higher to end wave (i) as a diagonal or the move can be part of a flat and will correct lower.

Ayoub Ben Rejeb غير متواجد حالياً  
رد مع اقتباس
عضو نشيط
 
تاريخ التسجيل: Dec 2013
الدولة: Tunisia
المشاركات: 282
خبرة السوق: أكثر من 5 سنوات
معدل تقييم المستوى: 13
Ayoub Ben Rejeb is on a distinguished road
افتراضي رد: Elliott Wave Analysis by EWF
93#
13 - 06 - 2017, 04:25 PM
اقتباس:
المشاركة الأصلية كتبت بواسطة THE-ZERO مشاهدة المشاركة
I will appreciate if you show us your view for the AUDNZD & EURJPY
EURJPY while holding below short term peak06/08 then can make another leg lower but we don't recommend selling as the pair already reahced extreme area from May peak.


AUDNZD has reahced extreme area from March peak and even a short term low is still expetced to happen but the cycle ahs enough number of swings to end.


Ayoub Ben Rejeb غير متواجد حالياً  
رد مع اقتباس
عضو نشيط
 
تاريخ التسجيل: Dec 2013
الدولة: Tunisia
المشاركات: 282
خبرة السوق: أكثر من 5 سنوات
معدل تقييم المستوى: 13
Ayoub Ben Rejeb is on a distinguished road
افتراضي رد: Elliott Wave Analysis by EWF
94#
13 - 06 - 2017, 06:36 PM
URCAD : Sell the Bounce Bearish Pattern

Today’s price action confirms that a possible top has been formed at the June 2/2017 high and EURCAD can be on the way lower to close a market gap that formed on April 23/2017. The turn lower will now give bears a chance to push the pair lower. Below we will show a possible scenario/bearish pattern where bears can enter the market and catch the move lower.

EURCAD 4 hour Possible Bearish Pattern: Traders need to wait for EURCAD to enter between the AB 1.618% – AB 2.24% Fib. levels where blue point C can possibly terminate and react with a bounce higher. If and when blue point C terminates in the suggested area traders will then wait for price to retrace/bounce higher back to the BC 0.50% Fib. retracement level where blue point D can terminate and trigger SELLS. If blue point C terminates in the suggested area and bounces higher to trigger SELLS stops should then be placed at the blue point B high.


If looking to sell EURCAD we prefer waiting for a retracement/bounce to trigger the blue point D sell at the BC 0.50%. Stops should be placed at 1.5255 (point blue B high) and should be sold at the BC 0.50% Fib. level minimum for a better risk/reward trade with targets below the April 23/2017 market gap.

Of course, like any strategy/technique, there will be times when the strategy/technique fails so proper money/risk management should always be used on every trade.

*** Always use proper risk/money management according to your account size ***
Ayoub Ben Rejeb غير متواجد حالياً  
رد مع اقتباس
عضو نشيط
 
تاريخ التسجيل: Dec 2013
الدولة: Tunisia
المشاركات: 282
خبرة السوق: أكثر من 5 سنوات
معدل تقييم المستوى: 13
Ayoub Ben Rejeb is on a distinguished road
افتراضي رد: Elliott Wave Analysis by EWF
95#
13 - 06 - 2017, 07:17 PM
Preparing for Quantitative Tightening

The Fed will soon embark in an uncharted water of Quantitative Tightening (QT). In the aftermath of 2008 global credit crisis, the world central banks went into the biggest experiment in monetary policy called Quantitative Easing (QE). Central banks printed money and bought the government bonds as the primary way for monetary expansion. The combined balance sheets of the three world central banks below exploded in size to about $13 trillion:


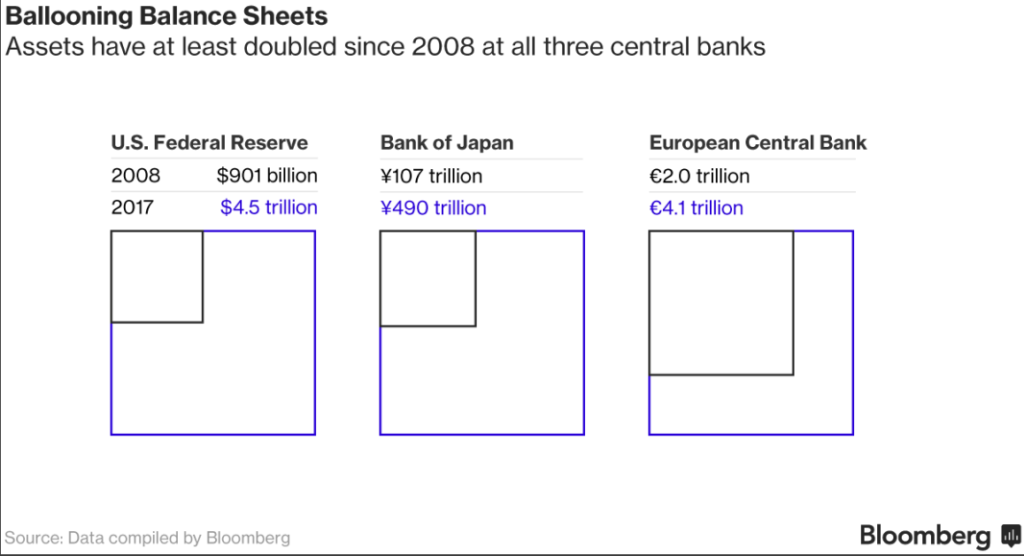
In the U.S., the Fed went into large-scale purchases from 2008 – 2013. They tapered the purchases gradually to zero by 2014. As a consequence, the Fed now holds US $1.8 trillion of mortgage-backed securities (MBS) and US $2.5 trillion of US Treasury Bonds. The Fed has been reluctant to reduce the balance sheet, fearing that mortgage rates and other long term borrowing cost can spike and hurt fragile US economy.

However, at its meeting last March 14-15, the Fed’s Monetary Policy Committee (FOMC) agreed it should start normalizing its $4.5 trillion balance sheet later this year. Another name for this “balance sheet normalization” is “Quantitative Tightening”. The Fed’s current practice is to buy new bonds when the old bonds mature. When the Fed starts the normalization, it will taper the reinvestment of principal. In other words, it will let the old bonds mature and not reinvest to buy new ones. This way the balance sheet shrinks as the Fed receives cash from maturing bonds and not reinvest it. The Fed can also decide to reduce the size of the balance sheet more rapidly by selling its securities holding. However, the passive and predictable option of not reinvesting is more likely.

The chart below projects Fed balance sheet if the Fed stops reinvesting principal from January 2018. By doing so, Fed’s balance sheet should be halved by the end of 2022.


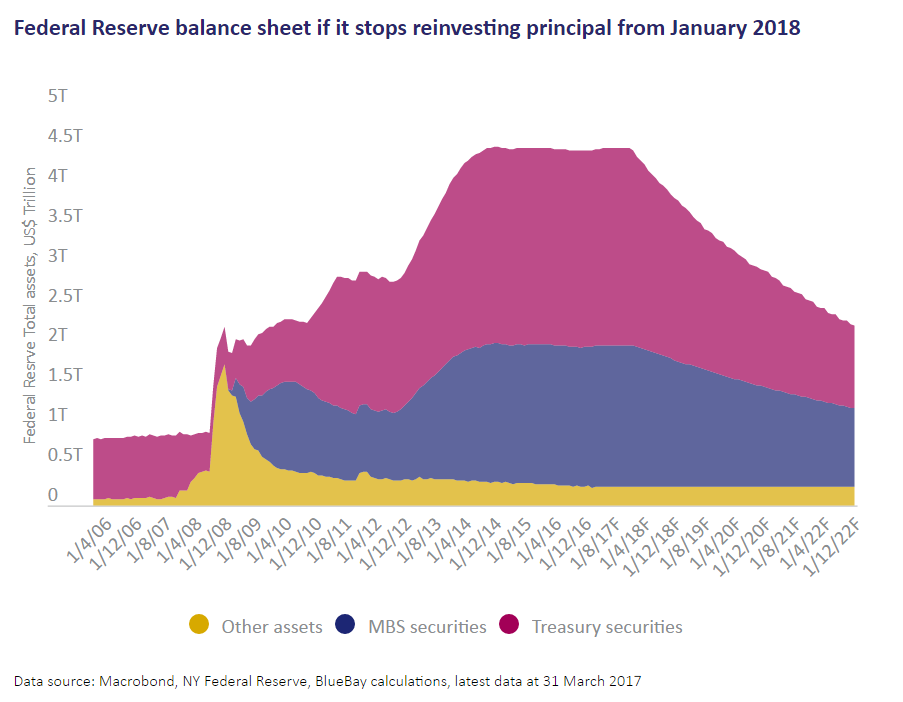
The Fed wants to get back to normal monetary policy by raising short term interest rate and shrinking the balance sheet. Interest rate is expected to go back to 2.5% by late 2018 (currently at 1%) while balance sheet is expected to shrink to $2 trillion by 2022. At Fed’s meeting on Wednesday this week, the Fed could announce the blueprint on how to do it.

Effect of Quantitative Tightening

The big question for investors is whether Quantitative Tightening will tighten monetary condition. The Fed has said that QT should not pose a problem to the economy and can be done gradually without disrupting the market. Philadelphia Fed President Patrick Harker even called the policy of shrinking the balance sheet as “watching paint dry.”

However, if QE resulted in higher inflation expectation, higher long bond yields, and encourage the holdings of risky assets, then in QT regime, we should expect the opposite. As central bank asset purchases diminish over the coming years, there is potential of material price declines in some assets. Both the stock and bond markets have come to depend on the Fed’s programs. S&P 500 has surged more than 250% from the 2008 low while interest rates remain low by historical standard.

In 2013, when Ben Bernanke accidentally hinted on QE tapering, stocks fell, interest rates rose and emerging stock and bond markets crashed, an event known as “taper tantrum”, as market worries about the implication of a less accommodative Fed. Thus, the reversal of the program, if not done the right way, can have major consequences.

10 Year Treasury Note (ZN) Monthly Outlook


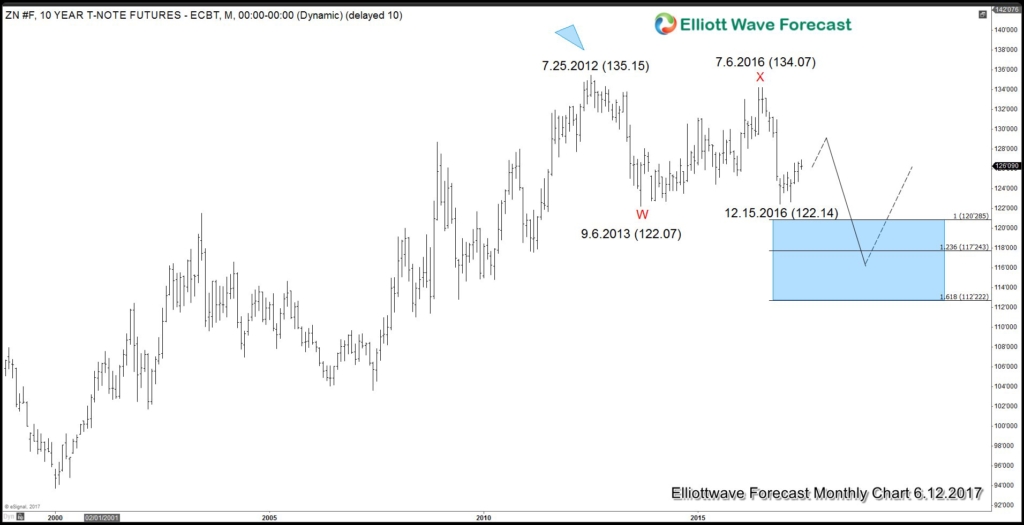
The 10 Year T-Note Monthly chart above shows a possible extension to the downside. It still needs to break below 9.6.2013 low (122.07) to confirm the next leg lower is possible. Near term, 10 Year T-Note may correct cycle from 7.6.2016 high first before turning lower. When the Fed stops reinvesting the principal into new bonds, the principle of supply and demand suggests there will be more supply of Treasury debt in the market that needs to find new buyers, thus it’s possible that the bond price falls and yields rise when the Fed starts normalizing the balance sheet.

The Fed’s Quantitative Tightening might have significant implication to all asset classes, including stock, bonds, and US Dollar.
Ayoub Ben Rejeb غير متواجد حالياً  
رد مع اقتباس
عضو فـضـي
 
تاريخ التسجيل: Jul 2010
المشاركات: 3,680
معدل تقييم المستوى: 19
THE-ZERO is on a distinguished road
افتراضي رد: Elliott Wave Analysis by EWF
96#
13 - 06 - 2017, 10:51 PM
thanks bro , is there any pair you recommend to go short or long and forget it for a month or even more..???
THE-ZERO غير متواجد حالياً  
رد مع اقتباس
عضو فـضـي
 
تاريخ التسجيل: Jul 2010
المشاركات: 3,680
معدل تقييم المستوى: 19
THE-ZERO is on a distinguished road
افتراضي رد: Elliott Wave Analysis by EWF
97#
13 - 06 - 2017, 10:55 PM
you forgot to attach chart for AUDNZD
where will be the expected target if we go long and hold..??
THE-ZERO غير متواجد حالياً  
رد مع اقتباس
عضو نشيط
 
تاريخ التسجيل: Dec 2013
الدولة: Tunisia
المشاركات: 282
خبرة السوق: أكثر من 5 سنوات
معدل تقييم المستوى: 13
Ayoub Ben Rejeb is on a distinguished road
افتراضي رد: Elliott Wave Analysis by EWF
98#
14 - 06 - 2017, 01:56 PM
GBPJPY Elliott Wave Analysis: Bearish Below 143.9

Short term GBPJPY Elliott Wave view suggests the decline from 5/10 high shows a 5 swing sequence, thus favoring more downside. Decline from 5/10 high is unfolding as a double three Elliott Wave structure. Down from 5/10 peak (148.11), Minor wave W ended at 141.47 and Minor wave X ended at 143.96. Minor wave Y is currently in progress and has scope to retest 4/16 low (135.58). Support can be seen at 135.7 – 137.3 area for at least 3 waves bounce.

Subdivision of Minor wave Y is proposed to be unfolding as a triple three Elliott Wave structure. Down from 6/1 peak (143.96), Minute wave ((w)) ended at 140.68, Minute wave ((x)) ended at 142.77, Minute wave ((y)) ended at 139.52 and Minute second wave ((x)) is in progress as a flat and expected to complete at 140.2 – 14.1.2 area. While near term bounce stays below 142.75, and more importantly below 143.95, expect pair to extend lower. We don’t like buying the pair.

GBPJPY 1 Hour Elliott Wave Chart 06/14/2017


Ayoub Ben Rejeb غير متواجد حالياً  
رد مع اقتباس
عضو نشيط
 
تاريخ التسجيل: Dec 2013
الدولة: Tunisia
المشاركات: 282
خبرة السوق: أكثر من 5 سنوات
معدل تقييم المستوى: 13
Ayoub Ben Rejeb is on a distinguished road
افتراضي رد: Elliott Wave Analysis by EWF
99#
14 - 06 - 2017, 02:43 PM
اقتباس:
المشاركة الأصلية كتبت بواسطة THE-ZERO مشاهدة المشاركة
you forgot to attach chart for AUDNZD
where will be the expected target if we go long and hold..??
I've attached the same chart of EURJPY
here is AUDNZD chart :


If the low is already in place then the target to the upside would be 1.1170
It's too early to call it as new lows can still be seen but the pair is in the process of bottoming both in daily & weekly which could take some time before doing a larger bounce.
Ayoub Ben Rejeb غير متواجد حالياً  
رد مع اقتباس
الصورة الرمزية AlaaFX
عضو نشيط جدا
الصورة الرمزية AlaaFX
 
تاريخ التسجيل: Feb 2012
الدولة: سوريا
المشاركات: 943
خبرة السوق: 1 الى 3 سنوات
معدل تقييم المستوى: 15
AlaaFX is on a distinguished road
افتراضي رد: Elliott Wave Analysis by EWF
100#
14 - 06 - 2017, 02:51 PM
سبحان من كرمنا واعلا شأننا باللغة العربية
Ayoub Ben Rejeb likes this.

التوقيع

AlaaFX غير متواجد حالياً  
رد مع اقتباس


إضافة رد

الكلمات الدلالية (Tags)
commodity, elliott wave, forex, stocks

أدوات الموضوع


جديد مواضيع منتدى تداول العملات العام

المواضيع المتشابهه
الموضوع كاتب الموضوع المنتدى مشاركات آخر مشاركة
elliott wave Nnana123 منتدى تداول العملات العام 6 11 - 04 - 2015 07:07 PM


12:08 PM