• 9:43 مساءاً


Elliott Wave Analysis by EWF

إضافة رد
Like Tree17Likes

عضو نشيط
 
تاريخ التسجيل: Dec 2013
الدولة: Tunisia
المشاركات: 282
خبرة السوق: أكثر من 5 سنوات
معدل تقييم المستوى: 13
Ayoub Ben Rejeb is on a distinguished road
افتراضي رد: Elliott Wave Analysis by EWF
161#
24 - 08 - 2017, 12:34 PM
USDJPY Elliott Wave view: Resuming lower

Short term USDJPY Elliott wave view suggest the decline from 7/11 peak is unfolding as a double three Elliott wave structure. Decline to 108.71 low ended Minor wave W and Minor wave X bounce ended at 110.95 peak. Subdivision of Minor wave Y is unfolding as a Zigzag structure. Minute wave ((w)) of ((Y) ended at 108.59 low and Minute wave ((x)) of (Y) bounce ended at 109.82. The pair has reacted lower from the blue box, but the move lower will get validation only with a break below 108.59. Until then a double correction in Minutte wave ((x)) still can happen.

Down from 108.59, Sub Minutte wave a of (y) ended at 108.82 low and the pair is in Sub Minutte wave b bounce to correct the decline from 109.82 peak. Near term, while bounces fail below 109.82 peak and more importantly below 110.95, expect pair to extend lower. Initial target to the downside is 108.35-108 area to complete Minutte wave (w). Afterwards, pair should bounce in Minutte wave (x) before the decline resumes. We don’t advise buying the pair and expect more downside in the pair as far as bounces fail below 110.95 peak.

USDJPY 1 Hour Elliott Wave Chart
Ayoub Ben Rejeb غير متواجد حالياً  
رد مع اقتباس

عضو نشيط
 
تاريخ التسجيل: Dec 2013
الدولة: Tunisia
المشاركات: 282
خبرة السوق: أكثر من 5 سنوات
معدل تقييم المستوى: 13
Ayoub Ben Rejeb is on a distinguished road
افتراضي رد: Elliott Wave Analysis by EWF
162#
25 - 08 - 2017, 12:08 PM
USDJPY Elliott Wave view: Double Correction

Short term USDJPY Elliott wave view suggests the decline from 7/11 peak is unfolding as a double three Elliott wave structure. Decline to 108.71 low ended Minor wave W and Minor wave X bounce ended at 110.95 peak. Subdivision of Minor wave Y is unfolding as another double three structure of a lesser degree. Minute wave ((w)) of ((Y) ended at 108.59 low and revised view suggests Minute wave ((x)) of (Y) bounce remains in progress to correct cycle from 8/16 peak towards 110.05 – 110.35 before pair turns lower. We don’t like buying the proposed bounce, and as far as pivot at 110.95 remains intact, expect sellers to appear at 110.05 – 110.35 for a new low or at least pullback in 3 waves.

USDJPY 1 Hour Elliott Wave Chart
Ayoub Ben Rejeb غير متواجد حالياً  
رد مع اقتباس
عضو نشيط
 
تاريخ التسجيل: Dec 2013
الدولة: Tunisia
المشاركات: 282
خبرة السوق: أكثر من 5 سنوات
معدل تقييم المستوى: 13
Ayoub Ben Rejeb is on a distinguished road
افتراضي رد: Elliott Wave Analysis by EWF
163#
28 - 08 - 2017, 04:42 PM
The Big Long in World Indices

Since the decline starting from year 2000, the world has been calling for a huge crash in world indices. The world indices did in fact corrected nicely in the year 2000 and 2009. The correction took the form of a FLAT Elliott wave structure and reached 50%-61.8% of the all-time rally in most of the world indices. This correction is even recorded in a movie titled “The Big Short” telling story about a group of traders shorting the market.

The crowd does not have enough with the 50%- 61.8 % correction between year 2000 and 2009, which is almost 9 years of correction. People want more and they want a crash after another crash. However, the reality is that the Market does not work that way. Most traders do not have a long career as most believe that the World Indices trend is bearish following the 2009 decline. This is a wrong bias which has cost traders billions of dollars.

The World Indices trend will always be bullish because it’s simply the Human nature. We used to live in the cave, but now we have a nice house, hotels and many other development to make our lives more comfortable. This is called progress, and by nature, we humans always will look for something better and the Indexes are a reflection of the Human progress. We understand that corrections are needed and they will always be a part of the Market. We can say that traders who shorted in 2007 – 2008 and caught the move lower got very lucky.

The World Indices ended the all-time cycle until that moment at 4.2.2000 and pullback in 7 swings into the 776 area using the $SPX as reference. By 2002, the correction has reached 50% of the all-time rally ina corrective 7 swing structure, and technically the correction was enough and a new bullish trend could develop. The World Indices even made a new high in 2007 and then crashed into a C wave completing a flat structure. Selling wave B at 2007-2008 high into wave C lower with a new high above the previous peak at 2000 is luck. Yes the move lower happened, but selling is against the trend at that time, and whoever caught that short got lucky.

It sounds and looks easy in a movie, but it is a wrong trade. It is a mass crowd trade, and we know better. We proposed “The Big Long” instead, which is more natural and easier to trade with no pain. The Index has rallied since 2009 and this rally is the good side of the Market, the one with no pain. The trend is always smoother and more natural, but most of the time the crowd does not see the trend. We do understand The Big long has reached the minimum target at 2234, if it is labelled as an ABC or a corrective sequence. However, the Market is saying more upside is possible and 3197 can still be reached if the Big Long becomes an extended Big Long.

Trading is about reading the Market and understanding the natural path and not forcing against the trend. We keep and will keep calling extension and buy into The Big long because we understand that pickers got it right one time and wrong 9 times. We would rather get it right 9 times and wrong 1 time. As we always said, nobody is 100% correct and it is impossible to be perfect, but when you trade the trend it becomes easier. The Big Short which everyone is waiting is a crowd and popular trade. The reality is that few people look the other side which is the Big long. This side is not over and can become extended Big Long.

SPX Elliott Wave Chart

Ayoub Ben Rejeb غير متواجد حالياً  
رد مع اقتباس
عضو نشيط
 
تاريخ التسجيل: Dec 2013
الدولة: Tunisia
المشاركات: 282
خبرة السوق: أكثر من 5 سنوات
معدل تقييم المستوى: 13
Ayoub Ben Rejeb is on a distinguished road
افتراضي رد: Elliott Wave Analysis by EWF
164#
28 - 08 - 2017, 04:57 PM
Royal Gold Bullish Structure Calling Higher

Royal Gold (NASDAQ: RGLD) is one of the world’s leading precious metals royalty & stream companies, it’s engaged in the acquisition and management of gold, silver, copper, lead and zinc. The Company owns interests on 194 properties in over 20 countries, including interests on 39 producing mines and 21 development stage projects.

During last week, Royal Gold announced fourth quarter dividend of US$0.24 per share of common stock payable on October 20, 2017. It’s stock price closed on Friday at new 5 years high with a total gain of +37% YTD and +250% from last year low.

The recent move higher during the month of August was significantly important for the stocks because the price managed to break above the 2016 peak and that opened a new extension to the upside. So let’s take a look at RGLD technical chart.

Royal Gold Elliott Wave Technical Analysis
RGLD rallied from 01/20/2016 low before topping at $87.74 on 08/02/2016. That peak held for 1 year in which the stock corrected for 4 months before resuming the move higher and finally managing to break it on 08/10/2017. Royal Gold is now showing an incomplete 5 swings bullish sequence from 2016 low and the stock is expected to continue to the upside toward the minimum target at equal legs area $123 – $138 with a possible extension toward $162.

RGLD Weekly Chart


Using Elliott Wave theory, we can label the move from 2016 low as a start of a 5 waves diagonal so that could be forming wave (III) or only the first leg of it because the 3rd wave usually extend toward the 1.618 fib ext level which will come around $187.

Royal Gold still needs to break above 2012 peak to confirm the bullish move higher and open another bullish sequence. So either way, the move will extend higher as 5 waves or will end up as 3 waves Zigzag ABC from 1991 low. The equal legs from there comes at $125 – $149 which is around the same extreme area from 2016 suggesting that the stock could see a pullback from that area before deciding the next path.

RGLD Monthly Chart


Recap

Royal Gold technical picture is strongly bullish after the recent break higher and that’s why buyers can be seen now during pullbacks in 3 , 7 or 11 swings with targets higher above $120 area unless the move higher is part of a flat structure which means it will still do another leg lower against 2016 before rallying again. The stock is getting support from the commodity sector overall and especially of rise in the price of precious metals.
Ayoub Ben Rejeb غير متواجد حالياً  
رد مع اقتباس
عضو نشيط
 
تاريخ التسجيل: Dec 2013
الدولة: Tunisia
المشاركات: 282
خبرة السوق: أكثر من 5 سنوات
معدل تقييم المستوى: 13
Ayoub Ben Rejeb is on a distinguished road
افتراضي رد: Elliott Wave Analysis by EWF
165#
28 - 08 - 2017, 08:43 PM
BBY Best Buy Earnings Report 08/29/17 – Weekly ElliottWave Count

BBY Best Buy Inc. earnings report due to this week, the 29th of August. Before we get into the details few words about the company we are about to analyze.
According to Wikipedia, Best Buy Co. (NYSE: BBY), Inc. is an American multinational consumer electronics corporation headquartered in Richfield, Minnesota, a Minneapolis suburb. Internationally, it also operates in Canada and Mexico. It was formerly operational in China until February 2011 (when the faction was merged with Five Star) and in Europe until 2012. According to Yahoo! Finance, Best Buy is the largest specialty retailer in the U.S. consumer electronics retail industry.

Regarding earning, Best Buy Co., Inc. is expected to report earnings the 29th of August 2017 before market open. The report will be for the fiscal Quarter ending Jul 2017. According to Zacks Investment Research, based on 12 analysts’ forecasts, the consensus EPS forecast for the quarter is $0.63. The reported EPS for the same quarter last year was $0.57.

Overall view, Best Buy (NYSE: BBY) shares are surging this year, a company many investors though was in big trouble because of the threat from Amazon. The stock is up by 55% this year and up by approximately 240% since the company named Hubert Joly as its CEO five years ago.


Main reasons why BBY Best Buy has been surging:

The Nintendo Switch console launch
Best Buy proved Amazon-proof in contrast with Circuit City and RadioShack
Despite the very encouraging data, it is worth to mention that the BBY stock is well behind AMZN’s performance. Since August 2012, AMZN stock is up by 300% yet if we account the S&P 500 is up by 75% during the same time frame and while the S&P Retail ETF (XRT) has risen only 25%, BBY Best Buy still has an astonishing performance.

Coming back to the Earnings subject, Jefferies raised Best Buy Sales and Earnings estimates on Tuesday for the second quarter, citing strength in the video game, appliance and smartphone categories.

“Based on our field checks and other research, we believe Best Buy should be able to grow domestic SSS [same-store sales] at the high end or better than mgmt.’s plan,” analyst Daniel Binder wrote in a note to clients. “We expect Best Buy to benefit from strength in appliances and connected home, however we also expect robust growth in entertainment from the introduction of two gaming consoles in Q1 and mobile to benefit from a full quarter of Samsung S8/S8+ availability.”
“We believe that Best Buy’s entertainment category saw a second consecutive quarter of robust growth driven by the launch of the Nintendo Switch and the 1TB PlayStation Slim Gold console as the company laps fairly significant comparable store sales declines in this category,” he wrote.
As a result, the analyst raised his July quarter Best Buy U.S. same-store sales growth estimate to 2.5 percent from 2.0 percent. He also increased his earnings-per-share forecast for the same quarter to 66 cents from 59 cents versus the Wall Street consensus of 63 cents.


Our View in ElliottWave-Forecast.com
When it comes to our BBY’s stock price analysis, Best Buy is still a buy in the dip on the weekly time frame while still missing the minimum target of the 70’s level. The 70’s price target is the equal legs of the (w) – (x) swing since the stock first started trading. The rally since 12/2012 as well seems incomplete. Price took the equal legs at the 56’s zone but RSI yet to show divergence, a fact suggesting we are most likely going to see the next level at the 1.236% extension around the 66’s, just 4$ from the equal legs at 70’s mentioned above.


BBY Best Buy Weekly Elliott Wave Count


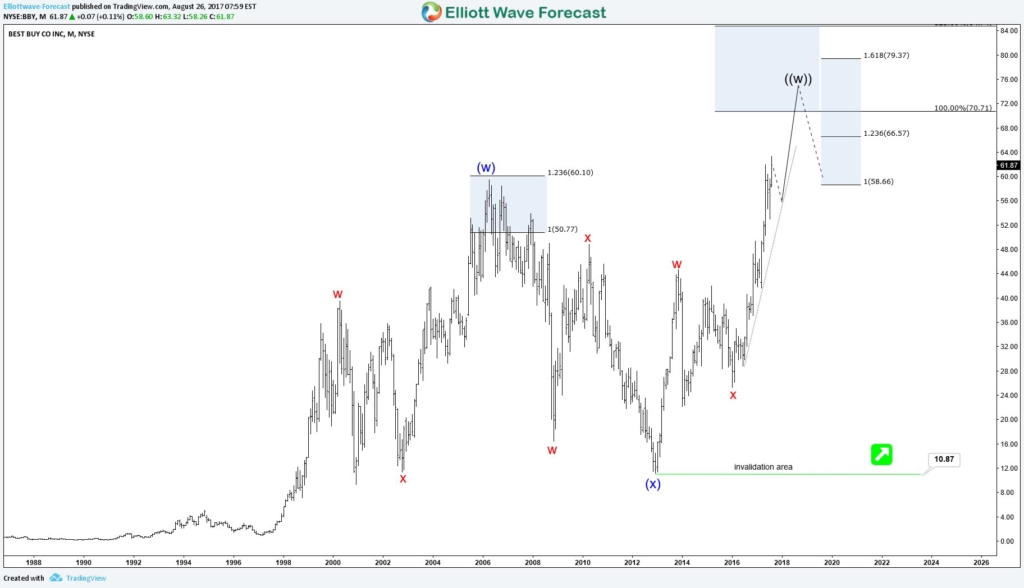
At this stage we would like to see price correcting down to the 56’s zone where the supporting trend line since 06/01/16 is holding. From there we expect price to bounce and ideally extend to new highs towards our target or at least create a 3 wave bounce which should provide longs the ability to get Risk Free.
Ayoub Ben Rejeb غير متواجد حالياً  
رد مع اقتباس
عضو نشيط
 
تاريخ التسجيل: Dec 2013
الدولة: Tunisia
المشاركات: 282
خبرة السوق: أكثر من 5 سنوات
معدل تقييم المستوى: 13
Ayoub Ben Rejeb is on a distinguished road
افتراضي رد: Elliott Wave Analysis by EWF
166#
29 - 08 - 2017, 04:57 PM
SPX Elliott Wave View: At Weekly Inflection Area

SPX S&P 500 Long Term Elliott Wave view suggests that the Index has reached the minimum target at 2234.35 to end a big cycle from an all time low. If we assume the Index starts from all-time low of 0, then the rally can be labeled as a zigzag Elliott Waves tructure. The first leg wave A ended in March 2000 at 1553.11 during the dot com bubble. From 2000 peak, the Index corrected in 3 waves and reached 50% retracement at 766.67 in the year 2002. SPX then started a new leg higher which broke above 2000 peak in October 2007. Technically, with the break above 2000 peak, S&P formed a bullish sequence (a higher high) from all-time low and the natural path is to extend higher, especially considering that it has corrected 50% into 2002.

As SPX formed a new peak in the year 2007, the Market did an unexpected detour. Instead of the natural path of extending higher, the Index declined strongly in 5 waves into the year 2009 during the financial crisis due to subprime mortgage default and collapse of Lehman Brothers. This collapse is even captured in the movie titled “The Big Short” when several traders made money by correctly betting on the ensuing crash. In reality however, these traders got lucky as they were trading against a natural cycle, which happens only in a wave C of a FLAT structure.

The decline broke below 2002 low, sentiment was very negative at that time and no one was talking about buying the Index. What people don’t realize is that the Market is a reflection of human progress and thus it should never go back to zero. Correction is natural and allows the market to reset. The Market ended a 3-3-5 Expanded Flat Elliott Wave structure in 2009 and then began the Big Long. Interestingly, nobody is filming or talking about the Big Long, and nowadays most people still talk about the impending big crash almost every single year even when the market keeps rallying. Almost nobody is talking about how great the move higher is as people don’t understand the primary trend in the human nature is up.

Right now, S&P has reached an interesting weekly inflection area in which we can label the entire move from all time 0 as a zigzag Elliott Wave Structure. Wave A started from all-time 0 to 2000 high. The 3 waves correction from 2000 high to 2009 low is labelled as wave B and take the form of Expanded Flat. Then from 2009 low to present day, it is labelled as wave C. The minimum target wave C = A at 2234.35 has been reached, but that doesn’t mean the Indices will crash from here. We acknowledge that the Index could indeed have a decent pullback from this area, but keep in mind that it’s possible for the Index to extend higher within the blue box at 2234.35 (100% of A-B) – 3196.41 (161.8% of A-B).

If the Index reaches 3196.41, then the whole move from all-time 0 can be labelled instead as 1-2-3. If reaching 3196.4, the third wave in this case is extended, which is the typical characteristic of wave 3 in an impulse. Thus the Big Long at this point in time can even become an extra Big Long, until it gets denied.

SPX S&P 500 Long Term Elliott Wave Chart
Ayoub Ben Rejeb غير متواجد حالياً  
رد مع اقتباس
عضو نشيط
 
تاريخ التسجيل: Dec 2013
الدولة: Tunisia
المشاركات: 282
خبرة السوق: أكثر من 5 سنوات
معدل تقييم المستوى: 13
Ayoub Ben Rejeb is on a distinguished road
افتراضي رد: Elliott Wave Analysis by EWF
167#
30 - 08 - 2017, 03:46 PM
CL_F Oil Elliott Wave View: Pullback in progress

Oil Short Term Elliott Wave suggests that the decline from 8/1 peak is unfolding as a double three Elliott Wave Structure where Minute wave ((w)) ended at 46.46 and Minute wave ((x)) ended at 48.76. Oil has since made a new low below Minute wave ((w)) at 46.46 suggesting the next leg lower has started. Wave ((y)) is in progress and also subdivided as a double three where Minutte wave (w) ended at 46.15 and Minutte wave (x) is proposed complete at 46.96.

Near term, while bounces stay below Minute wave ((x)) at 48.76, Oil has scope to extend lower towards 43.92 – 44.85. This is an inflection area where Minute wave ((w)) = Minute wave ((y)) and buyers can appear in this area for at least a 3 waves bounce. We don’t like selling Oil and expect buyers to appear at 43.92 – 44.85 area (if reached) for at least a 3 waves bounce, provided that pivot at 6/21 low (42.07) remains intact.

Oil 1 Hour Elliott Wave Chart
Ayoub Ben Rejeb غير متواجد حالياً  
رد مع اقتباس
عضو نشيط
 
تاريخ التسجيل: Dec 2013
الدولة: Tunisia
المشاركات: 282
خبرة السوق: أكثر من 5 سنوات
معدل تقييم المستوى: 13
Ayoub Ben Rejeb is on a distinguished road
افتراضي رد: Elliott Wave Analysis by EWF
168#
31 - 08 - 2017, 03:13 PM
GBPJPY Elliott Wave View: Ending correction

GBPJPY Short Term Elliott Wave suggests that the decline to 8/23 low at 139.27 ended Minor wave W. Minor wave X bounce is currently unfolding as a double three Elliott Wave Structure. Minute wave ((w)) of X ended at 141.47, Minute wave ((x)) of X ended at 139.98, and Minute wave () of X is subdivided into a FLAT. Minutte wave (a) of (
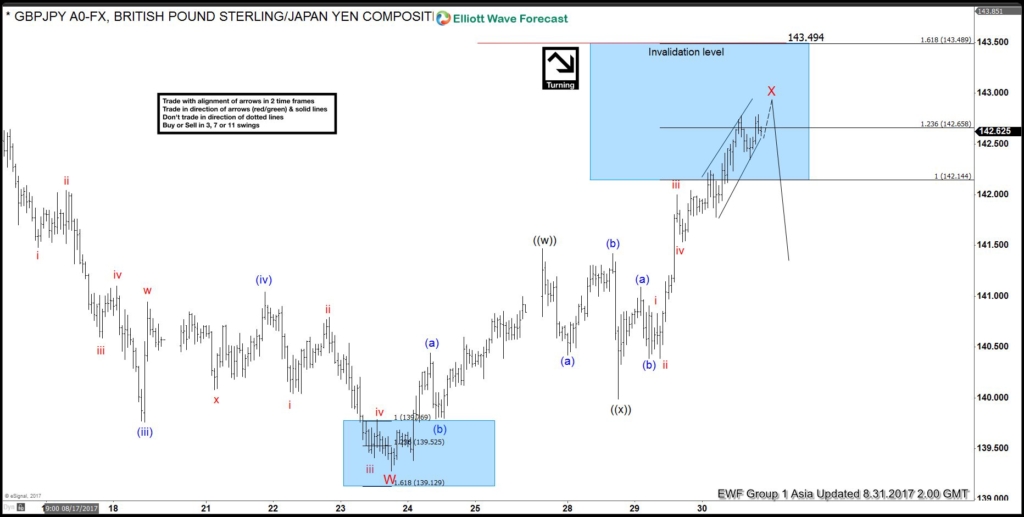
) ended at 141.09 and Minutte wave (b) of () ended at 140.39. Minute wave () of X has now reached 1.236 extension of ((w))-((x)) and thus the cycle from 8/23 low (139.27) is mature. Sellers may appear anytime from 142.65 – 143.49 area for an extension lower or at least a 3 waves pullback. We don’t like buying the pair.

GBPJPY 1 Hour Elliott Wave View
Ayoub Ben Rejeb غير متواجد حالياً  
رد مع اقتباس
عضو جديد
 
تاريخ التسجيل: Aug 2009
المشاركات: 230
معدل تقييم المستوى: 17
محمدي. is on a distinguished road
افتراضي رد: Elliott Wave Analysis by EWF
169#
31 - 08 - 2017, 03:43 PM
الدولار كندي لوسمحت
محمدي. غير متواجد حالياً  
رد مع اقتباس
عضو نشيط
 
تاريخ التسجيل: Dec 2013
الدولة: Tunisia
المشاركات: 282
خبرة السوق: أكثر من 5 سنوات
معدل تقييم المستوى: 13
Ayoub Ben Rejeb is on a distinguished road
افتراضي رد: Elliott Wave Analysis by EWF
170#
01 - 09 - 2017, 07:39 PM
GBPJPY Elliott Wave View: Wave Red X Still in Progress

GBPJPY Short Term Elliott Wave suggests that the decline to 8/23 low at 139.27 ended Minor wave W. Minor wave X bounce is currently still in progress as a double three Elliott Wave Structure. Minute wave ((w)) of X ended at 141.47, Minute wave ((x)) of X ended at 139.98, and Minute wave ((y)) of X is proposed complete at 142.93. The move higher from Minor W can be counted as a triple three. In this case, it will open extension higher to 143.75 – 144.27 area before pair turns lower.

GBPJPY 1 Hour Elliott Wave View
Ayoub Ben Rejeb غير متواجد حالياً  
رد مع اقتباس


إضافة رد

الكلمات الدلالية (Tags)
commodity, elliott wave, forex, stocks

أدوات الموضوع


جديد مواضيع منتدى تداول العملات العام

المواضيع المتشابهه
الموضوع كاتب الموضوع المنتدى مشاركات آخر مشاركة
elliott wave Nnana123 منتدى تداول العملات العام 6 11 - 04 - 2015 07:07 PM


09:43 PM