• 3:12 مساءاً


Elliott Wave Analysis by EWF

إضافة رد
Like Tree17Likes

أدوات الموضوع
عضو نشيط
 
تاريخ التسجيل: Dec 2013
الدولة: Tunisia
المشاركات: 282
خبرة السوق: أكثر من 5 سنوات
معدل تقييم المستوى: 11
Ayoub Ben Rejeb is on a distinguished road
افتراضي رد: Elliott Wave Analysis by EWF
201#
18 - 10 - 2017, 02:33 PM
Elliott Wave Theory Structure; An Ending Diagonal

An ending diagonal is a type of impulsive motive wave in Elliott Wave Theory that will be found in the subdivision of fifth waves or whole C waves in a structure. An ending diagonal C wave or 5th wave commonly shows an obvious wedge shape with an overlapping wave 1 and wave 4. These will subdivide into 3-3-3-3-3 however an overlapping wave 1 and wave 4 are not required conditions that must be met. The overlap may or may not happen thus it is acceptable for there to not be any overlap. These structures will appear in either bullish or bearish markets in all time frames. For reference shown at the bottom there is a couple of bullish examples the above mentioned wave C’s & 5th’s describes.

There are a few conditions that ending diagonal waves have in common with a regular impulse. Firstly the whole structure will be five waves however it will subdivide into the aforementioned 3-3-3-3-3 instead of 5-3-5-3-5. Secondly the wave three will not be the shortest of the five wave move thus either the wave one or the fifth wave will be shorter than the wave three. Finally the fifth wave of a bullish market ending diagonal will have a lower momentum reading such as on a RSI indicator where it will be showing some divergence compared to the wave three. Correspondingly in a bearish market ending diagonal the wave three will have the lower momentum indicator or RSI reading when compared to the wave five.

Keep in mind a five wave motive, whether a regular impulse with the 5th wave being an ending diagonal or an ending diagonal wave C itself will be commonly seen in the larger double three combination structures such as in the C wave ending moves of zig-zags as well as in flats of each of the three types .


Ayoub Ben Rejeb غير متواجد حالياً  
رد مع اقتباس

عضو نشيط
 
تاريخ التسجيل: Dec 2013
الدولة: Tunisia
المشاركات: 282
خبرة السوق: أكثر من 5 سنوات
معدل تقييم المستوى: 11
Ayoub Ben Rejeb is on a distinguished road
افتراضي رد: Elliott Wave Analysis by EWF
202#
19 - 10 - 2017, 05:21 PM
AUDUSD Intra Day Elliott Wave Analysis

AUDUSD Short Term Elliott Wave view suggests that Primary wave ((W)) ended at 0.7731 on October 6th low. Up from there, Primary wave ((X)) is currently unfolding as a double three Elliott Wave structure. Intermediate Wave (W) of ((X)) ended at 0.7807 and Intermediate wave (X) of ((X)) ended at 0.7815. Near term, while pullbacks stay above 0.7815, but more importantly above 10/6 low at 0.7731, expect pair to extend higher. At this stage, pair still needs to break above Intermediate wave (W) at 0.7815 to give more validity to this view. Until then, we can’t rule out a double correction in Intermediate wave ((X)).

AUDUSD 1 Hour Elliott Wave Chart
Ayoub Ben Rejeb غير متواجد حالياً  
رد مع اقتباس
عضو نشيط
 
تاريخ التسجيل: Dec 2013
الدولة: Tunisia
المشاركات: 282
خبرة السوق: أكثر من 5 سنوات
معدل تقييم المستوى: 11
Ayoub Ben Rejeb is on a distinguished road
افتراضي رد: Elliott Wave Analysis by EWF
203#
25 - 10 - 2017, 11:56 AM
FTSE Intra Day Elliott Wave Analysis

FTSE Elliott Wave view suggests that Primary wave ((4)) ended with the decline to 7199.5. Up from there, rally is unfolding as an impulse Elliott Wave structure where Minor wave 1 ended at 7327.5 and Minor wave 2 ended at 7289.75. Rally to 7494.34 ended Minor wave 3, and pullback to 7473.12 ended Minor wave 4. The last leg Minor wave 5 ended at 7565.11 and this also ended Intermediate wave (A) of a zigzag Elliott Wave structure from 9/15 low (7199.5).

Intermediate wave (B) is currently in progress as a double three Elliott Wave structure. From 7565.11 high, Minor wave W ended at 7485.42 and Minor wave X bounce ended at 7560.04. Near term, while bounces stay below 7565.11, expect the Index to turn lower towards 7431 – 7481 area to complete Intermediate wave (B). Afterwards, Index should resume the rally to new high or at least bounce in 3 waves. We don’t like selling the proposed pullback.

FTSE 1 Hour Elliott Wave Analysis
Ayoub Ben Rejeb غير متواجد حالياً  
رد مع اقتباس
عضو نشيط
 
تاريخ التسجيل: Dec 2013
الدولة: Tunisia
المشاركات: 282
خبرة السوق: أكثر من 5 سنوات
معدل تقييم المستوى: 11
Ayoub Ben Rejeb is on a distinguished road
افتراضي رد: Elliott Wave Analysis by EWF
204#
26 - 10 - 2017, 03:22 PM
Elliott wave: Are the Indices ending 5 waves or not?

Elliott wave: The 5 waves advance

The Elliott wave Theory is a famous trading tool and is based in the idea that the Market advances in 5 waves and corrects in 3 waves. The Theory has some basic rules which are listed below

1) Wave 2 never retraces more than 100% of wave 1.

2) Wave 3 cannot be the shortest of the three impulse waves, namely waves 1, 3 and 5.

3) Wave 4 does not overlap with the price territory of wave 1, except in a diagonal formation.

Elliott Wave Theory: A 5 waves Advance

These rules are the ones which appear in a 5 waves advance but also the one that make traders around the globe to be misled into trading on wrong side of the Market. Many traders develop the habit to pick tops and trade into corrections when they see what looks like a 5 waves move and believe that a pullback or sell off is imminent. The reality is that those 3 rules are not enough and we have been saying for years that the Theory is too simple and too old to be used without any other tools. We have added several new rules or conditions to validate the Market and consequently gain an edge over the Market and the theory itself. In this blog, we will explain why the YM #F which is the Dow Jones Futures is being wrongly counted as a 5 waves move from 2 significant lows i.e. the 2009 cycle and the 2.2016 low cycle. We believe wave 5 in an advance needs to provided momentum divergence against the peak of wave 3 , otherwise the move is either corrective and ending a 3 waves advances or even more powerful when the market is still within the wave 3 with the waves 4 and 5 to come. Let’s now take a look at the charts below

YM#F Cycle from 2.2016 low: 5 Waves or not?


The Chart above is showing the cycle since 2.2016 low and if we look at RSI at the bottom of the chart, we can see that move from 8.2017 low has erased RSI divergence with respect to 3.2017 peak , in other words RSI is currently at the highest level since the move started from 2.2016 low so we are either ending the whole cycle as a 3 waves corrective sequence or still within wave 3 of a 5 waves advance.

YM#F Cycles from 2009 low (Price and RSI)


The Chart above is showing the cycle since lows at 2009 and we can see how the price have erased the divergence within the cycle and showing 5 swings, meaning it’s not a 5 waves advance. We can see how both cycles have erased divergence compared to the higher read within the cycle which mean that current rally is the peak in both degrees and more upside should happen in the long term cycles. The Market is a combinations of cycles and time frames and traders need to upgrade and downgrade the Instrument be able to provide a reliable forecast or wave count. We are always trying to help members and non-members to understand the Elliott wave Theory and applying it to according to the current times instead of following the theory in it’s original form which is too simple and without additional tools, doesn’t help to avoid falling into the traps laid out by the Market every day. The Relative Strength Index (RSI), developed by J. Welles Wilder, is a momentum oscillator that measures the speed and change of price movements. The RSI oscillates between zero and 100, the instrument gather the strength of the move and we used every day in our charts and forecast, we always aid a wavers without the RSI won’t be able to get the desired results and today the proof is that, we are not ending a 5 waves move in the YM# F (Dow Jones). We are either ending wave 3 with 4 and 5 to come or we are ending a correcting advance since the lows at 2.2016. We do understand the optical view of the 5 waves advances but the RSI is denying the notion of 5 waves so it’s better to find a count which fit the criteria instead of forcing and eventually falling into the trap. The cycle from 2.2016 can end soon and provide a pullback and another chance to buy, but if the pullback happens without a 4-5, then the structure will become corrective from 2009 and 2016 cycle.
Ayoub Ben Rejeb غير متواجد حالياً  
رد مع اقتباس
عضو نشيط
 
تاريخ التسجيل: Dec 2013
الدولة: Tunisia
المشاركات: 282
خبرة السوق: أكثر من 5 سنوات
معدل تقييم المستوى: 11
Ayoub Ben Rejeb is on a distinguished road
افتراضي رد: Elliott Wave Analysis by EWF
205#
27 - 10 - 2017, 01:48 PM
Gold Elliott wave view: Double three

Short term Gold Elliott Wave view suggests that the rally from 10/06 low (1260.52) to 10/16 peak (1306.35) ended intermediate wave (X) then the decline from there is unfolding as a a double three Elliott wave structure. As the structure of the 10/16 peak looks to be overlapping, hence suggesting its corrective structure, either W, X, Y or W, X, Y, Z.

The first leg lower ended in Minute wave ((w)) at 1276.34 & bounce to 1291.17 ended Minute wave ((x)). Minute wave ((y)) currently in progress as double three structures. Where Minutte wave (w) ended at 1272.43 low and Minutte wave (x) bounce at 1283.54 as a flat. Near term, as far as bounces fails below 1291.17 peak metal has scope to extend 1 more push lower towards 1261.19-1254.42 100%-123.6% Fibonacci extension area from 10/16 peak. Afterwards it should end the cycle from 10/16 peak and should do a 3 wave bounce minimum. We don’t like buying the metal and as far as bounces fails below the 1291.17 peak and more importantly the pivot from 10/16 peak stays intact metal is expected to trade lower.

Gold 1 Hour Elliott Wave Chart
Ayoub Ben Rejeb غير متواجد حالياً  
رد مع اقتباس
عضو نشيط
 
تاريخ التسجيل: Dec 2013
الدولة: Tunisia
المشاركات: 282
خبرة السوق: أكثر من 5 سنوات
معدل تقييم المستوى: 11
Ayoub Ben Rejeb is on a distinguished road
افتراضي رد: Elliott Wave Analysis by EWF
206#
27 - 10 - 2017, 02:01 PM
FTSE Elliott Wave Analysis: Ended Correction

FTSE Elliott Wave view suggests that decline to 7199.5 ended Primary wave ((4)). Up from there, the rally is unfolding as an impulse Elliott Wave structure where Minor wave 1 ended at 7327.5 and pullback to 7289.75 ended Minor wave 2. Rally to 7494.34 ended Minor wave 3, and pullback to 7473.12 ended Minor wave 4. Minor wave 5 ended at 7565.11 and this also ended Intermediate wave (A) of a zigzag Elliott Wave structure from 9/15 low (7199.5).

Intermediate wave (B) pullback unfolded as a double three Elliott Wave structure where Minor wave W of (B) ended at 7485.42, Minor wave X of (B) ended at 7560.04 and Minor wave Y of (B) ended at 7437.42. Near term, while pullbacks stay above 7347.42, and more importantly as far as pivot at 9/15 low (7196.09) stays intact, expect Index to extend higher. We don’t like selling the Index.

FTSE 1 Hour Elliott Wave Analysis
Ayoub Ben Rejeb غير متواجد حالياً  
رد مع اقتباس
عضو نشيط
 
تاريخ التسجيل: Dec 2013
الدولة: Tunisia
المشاركات: 282
خبرة السوق: أكثر من 5 سنوات
معدل تقييم المستوى: 11
Ayoub Ben Rejeb is on a distinguished road
افتراضي رد: Elliott Wave Analysis by EWF
207#
02 - 11 - 2017, 12:25 PM
DAX Intra-Day Elliott Wave Analysis

The rally in DAX from 8/29 low is unfolding as a double three Elliott Wave structure where Intermediate wave (W) ended at 13089 and pullback to 12903 ended Intermediate wave (X). Up from there, the rally from 12903 low looks to be unfolding as an impulse. Minute wave ((i)) ended at 13066 and pullback to 12906.5 ended Minute wave ((ii)). Minute wave ((iii)) remains in progress and expected to end with one more leg higher. Afterwards, Index should pullback in Minute wave ((iv)) before another leg higher in Minute wave ((v)) of A. We don’t like selling the Index in any proposed pullback. For the impulse view to remain valid, ideally Minute wave ((iv)) pullback later should not retrace more than 50% of Minute wave ((iii)). Near term, while pullbacks stay above 12903 low, expect the Index to extend higher.

DAX 1 Hour Elliott Wave Analysis
Ayoub Ben Rejeb غير متواجد حالياً  
رد مع اقتباس
عضو نشيط
 
تاريخ التسجيل: Dec 2013
الدولة: Tunisia
المشاركات: 282
خبرة السوق: أكثر من 5 سنوات
معدل تقييم المستوى: 11
Ayoub Ben Rejeb is on a distinguished road
افتراضي رد: Elliott Wave Analysis by EWF
208#
13 - 11 - 2017, 01:58 PM
First Solar FSLR Recovery in Progress

First Solar (NASDAQ: FSLR) designs and manufactures solar modules using a proprietary thin film semiconductor technology. The company has developed, financed, engineered, constructed and currently operates many of the world’s largest grid-connected PV power plants.

First Solar relies almost entirely on utility-scale projects which accounts for over half of the U.S. solar market and can be affected by the potential solar import tariffs by the Trump administration. However, preparation were already made to avoid such a step-back and the company booked 4.5 GW of panel and system sales in the previous quarter, more than it makes in a year.

After last month’s better than expected earnings report and the fact that utilities and project developers are booking tariff-free panels to lock up supply in 2018 helped First Solar shares to jump over 20% and the technical picture for its stock is looking for more gains in the coming months.

FSLR Monthly Chart


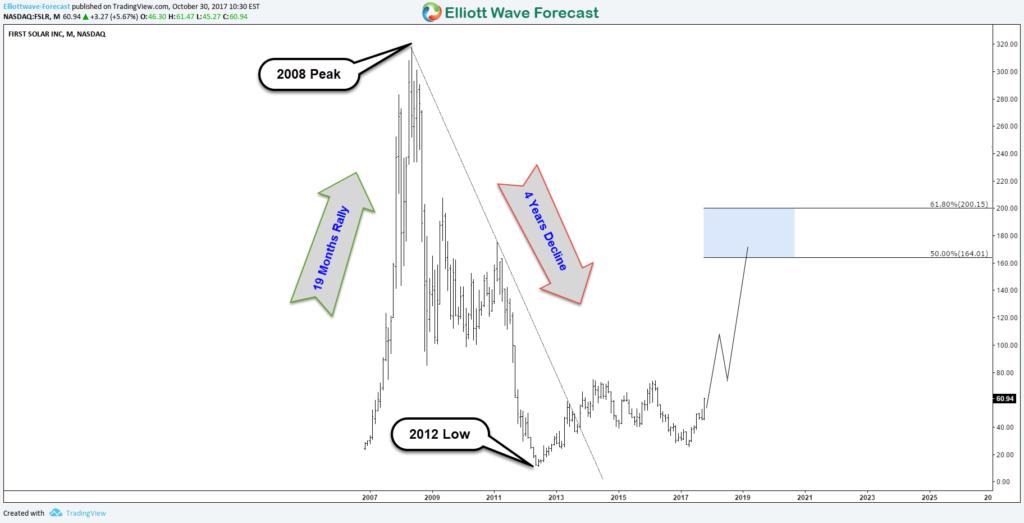
First Solar saw an impressive 1100% rally in the first 19 months after its IPO ($20) before it started declining from 2008 peak ($317) like the rest of the stock market around that period. The 3 swings decline lasted 4 years and erased all the gains saw previously until the stock found a bottom in May 2012 at $11.43. Up from there, FSLR bounced higher either to start new bullish cycle to the upside or at least to correct the decline toward the 50% – 61.8% Fibonnacie retracement area $164 – $200.

FSLR Elliot Wave Weekly Chart

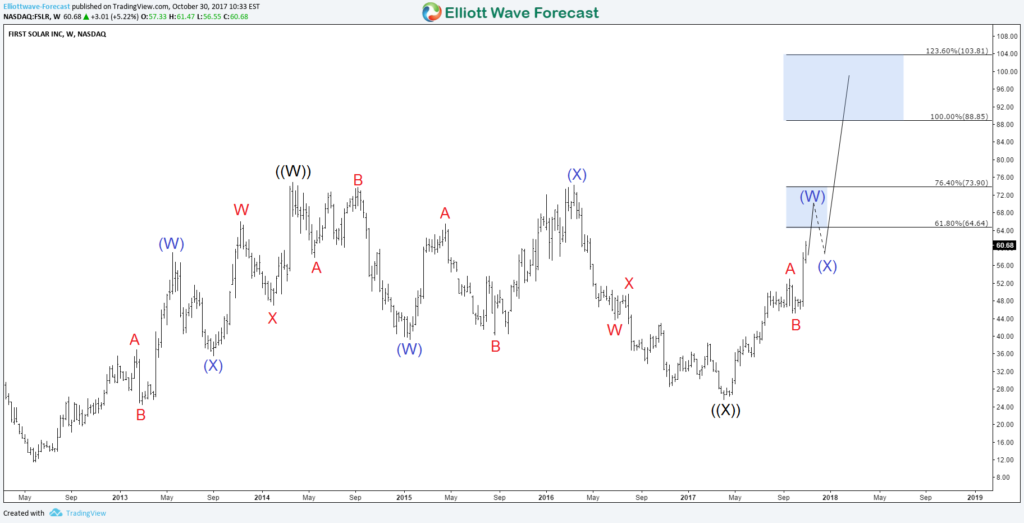
Up from May 2012 low, FSLR rallied in a corrective 7 swing sequence which indicates the stock is still in a correction stage then it did another double three to the downside which ended on April of this year. Afterward, the stock started another rally which still needs to break above 2014 peak to target equal legs area $88 – $103 as a first step of a larger move.

In the short term, FSLR is looking to reach $69.1 – 72.5 area where a 3 waves pullback can take place before it can resume the move higher, consequently the stock should remain supported while holding above 45.26 low.

Recap

First Solar booked most of its production for the next two years, which gives it a tremendous amount of certainty and could present a good investment. Technically the stock is still recovering from the fall since 2008 peak but will it be a fast recovery or a slow sideways bounce? Only time will tell but the overall picture remain in favor of the Solor Energy sector and companies like First Solar or SunPower (NASDAQPWR) are have more potential in the future.
Ayoub Ben Rejeb غير متواجد حالياً  
رد مع اقتباس
عضو نشيط
 
تاريخ التسجيل: Dec 2013
الدولة: Tunisia
المشاركات: 282
خبرة السوق: أكثر من 5 سنوات
معدل تقييم المستوى: 11
Ayoub Ben Rejeb is on a distinguished road
افتراضي رد: Elliott Wave Analysis by EWF
209#
14 - 11 - 2017, 01:34 PM
CADJPY Elliott Wave Analysis 11.14.2017

CADJPY Elliott Wave view suggests that the decline to 87.78 ended Minor wave X. Pair starts a new rally from there as a double three Elliott Wave structure where Minute wave ((w)) ended at 89.8. Minute wave ((x)) pullback is currently in progress to correct cycle from 10/31 low in 3, 7, or 11 swing before the rally resumes, provided that pivot at 10/31 low (87.78) stays intact. Subdivision of Minute wave ((x)) is unfolding also as a double three Elliott Wave structure where Minutte wave (w) ended at 88.96 and Minutte wave (x) ended at 89.64. Near term, while bounces stay below 89.8, expect pair to extend lower in Minutte wave (y) of ((x)) towards 88.56 – 88.76 area before pair resumes the rally higher or at least bounce in 3 waves. We don’t like selling the pair.

CADJPY 1 Hour Elliott Wave Analysis
Ayoub Ben Rejeb غير متواجد حالياً  
رد مع اقتباس
عضو نشيط
 
تاريخ التسجيل: Dec 2013
الدولة: Tunisia
المشاركات: 282
خبرة السوق: أكثر من 5 سنوات
معدل تقييم المستوى: 11
Ayoub Ben Rejeb is on a distinguished road
افتراضي رد: Elliott Wave Analysis by EWF
210#
14 - 11 - 2017, 01:46 PM
SPX Bounce from the 8/21 lows is Impulsive

Hi fellow traders. The $SPX Bounce from the 8/21 lows is impulsive as the title suggests and does display the usual characteristic traits of an Elliott Wave impulse. Looking back previously before this 8/21 date, the stock index is within an obvious uptrend in multiple degrees. For purpose of this particular blog we are mainly focused upon this particular time frame in four hours up from that aforementioned 8/21 low. The point is to try to tell and show what to look for ideally happening in the near term to help get a shorter term trader in position to capitalize on the pending and conditional dip that can be seen correcting the uptrend cycle from the 8/21 lows. That is to identify the area the wave (4) pullback can reach. Longer term traders and investors should be able to stand back and enjoy the benefit on being long in the uptrend.

That being said, the dip to 2566 from the 2597 highs of 11/7 , coupled with other correlated instruments was strong enough in our system to suggest it was correcting the cycle from the 8/21 wave (2) lows. The one condition mentioned above is there is an ongoing bounce in wave X shown in the graphic chart below that currently shows an equal legs extension area at 2594 where it may or not reach or as well it can even exceed. What the bounce will need to do is fail below the 11/7 highs at 2597 and turn lower for another swing below 2566 otherwise there is a risk that the wave (3) is extending higher. This is very common for an Elliott Wave three of any degree to extend with the trend and is just another reason a trader should not trade into a correction against the trend. If the dip materializes as proposed then great, buy into it and join the uptrend on the right side of the market.

Finally and back to what the point here is identifying the area the wave (4) dip can reach is as per the following. After the proposed wave X ends and it breaks below 2566 again, a measurement from the wave (3) highs of 11/7 down to the 2566 lows then up to the wave X highs will give the equal legs to 1.236 extension area for the dip in wave Y of (4). The Fibonacci extension will usually be more precise as compared to the usual Fibonacci retracement area in a wave four. As it stands now while below the 11/7 highs a typical wave four will retrace .236 to .382 of a wave three. That area comes in at the 2554-2528 region.

Ayoub Ben Rejeb غير متواجد حالياً  
رد مع اقتباس


إضافة رد

الكلمات الدلالية (Tags)
commodity, elliott wave, forex, stocks


جديد مواضيع منتدى تداول العملات العام

المواضيع المتشابهه
الموضوع كاتب الموضوع المنتدى مشاركات آخر مشاركة
elliott wave Nnana123 منتدى تداول العملات العام 6 11 - 04 - 2015 07:07 PM


03:12 PM