• 12:22 مساءاً


Elliott Wave Analysis by EWF

إضافة رد
Like Tree17Likes

عضو نشيط
 
تاريخ التسجيل: Dec 2013
الدولة: Tunisia
المشاركات: 282
خبرة السوق: أكثر من 5 سنوات
معدل تقييم المستوى: 13
Ayoub Ben Rejeb is on a distinguished road
افتراضي رد: Elliott Wave Analysis by EWF
261#
31 - 05 - 2018, 05:32 PM
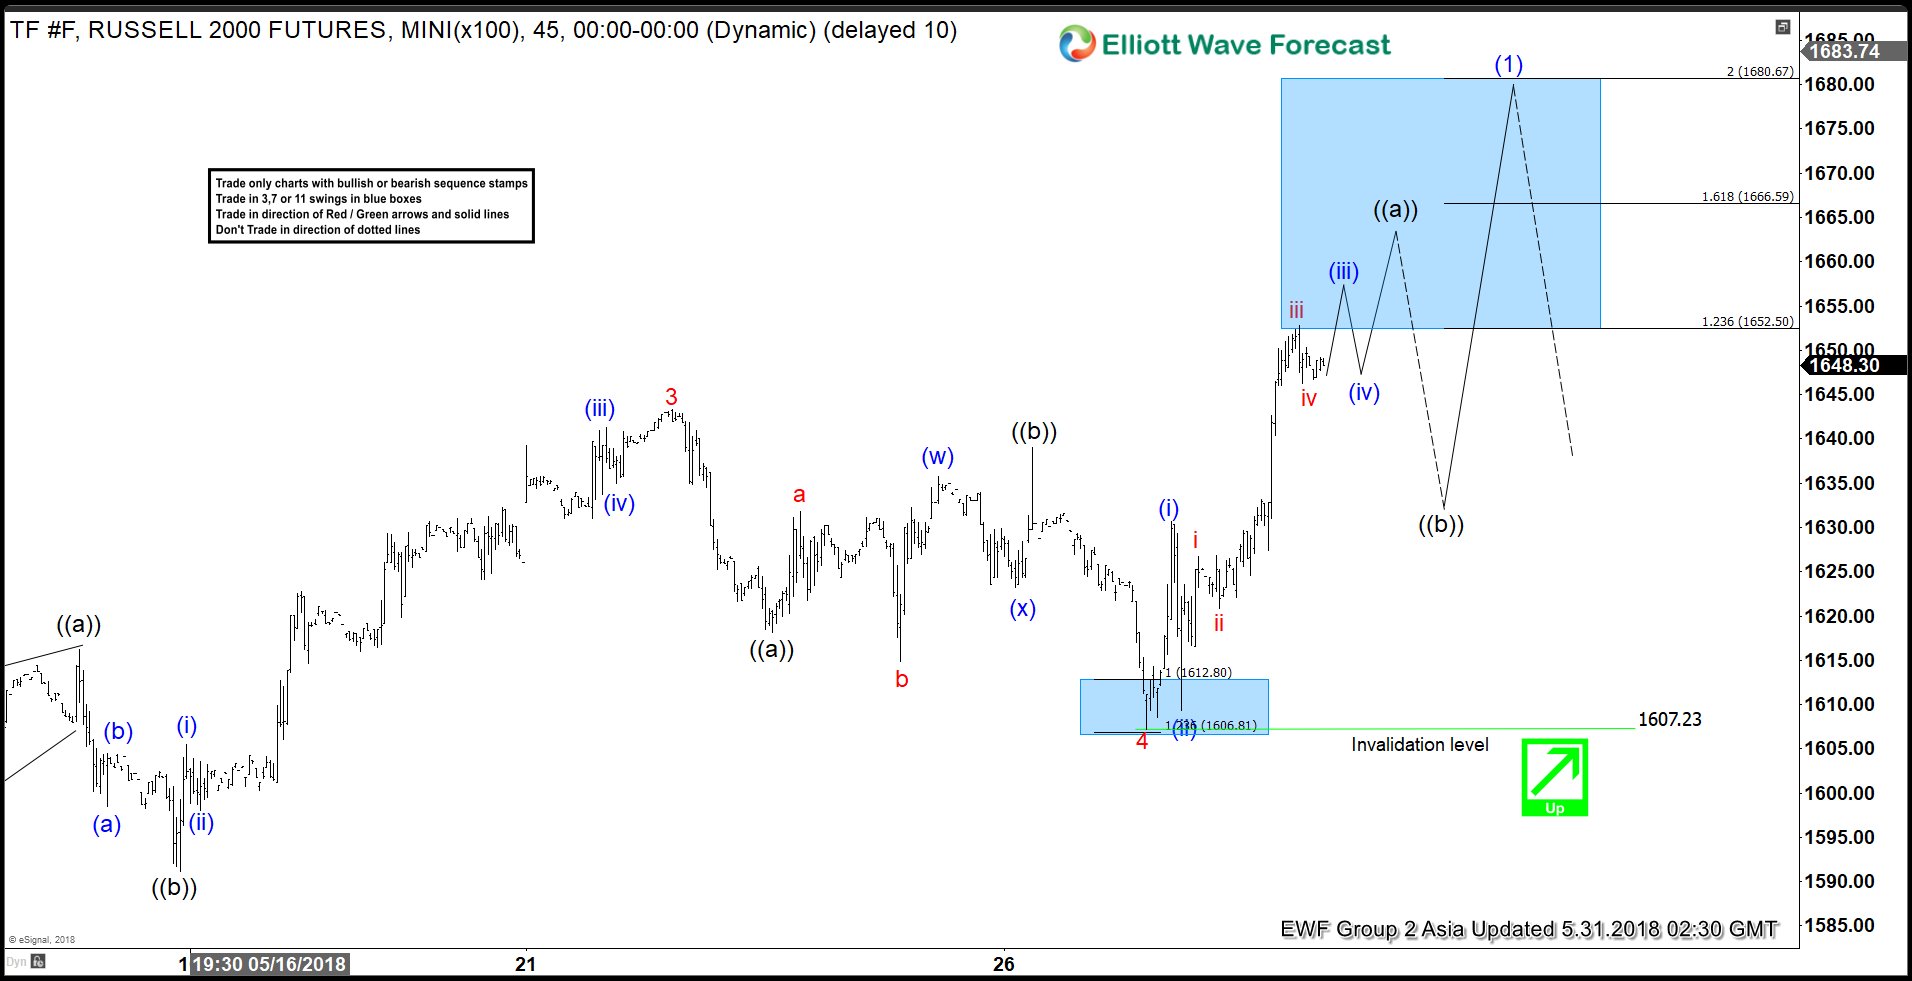
Elliott Wave View: Russell (TF_F) Pullback Around The Corner?

Russell (TF_F) index short-term Elliott Wave view suggests that the rally from April 02.2018 low (1482.6) is taking a form of an Elliott wave leading diagonal structure within Intermediate wave (1) higher. Leading diagonal structure usually appears as the sub-division of a wave (1) of an impulse or wave (A) of a Zigzag structure. The internal sub-division of a leading diagonal can either be 5,3,5,3,5 or 3,3,3,3,3.

In Russell’s case, the internal sub-division of Intermediate wave (1) is unfolding in 3.3.3.3.3. Minor wave 3 of (1) ended at 1643.3 as corrective 3 waves (zigzag) structure. Where Minute wave ((a)) of 3 ended at 1616.2. Minute wave ((b)) of 3 ended 1591.2. And Minute wave ((c)) of 3 ended at 1643.3. Down from there the pullback to 1607.23 low ended Minor wave 4 of (1) with internals also as a zigzag structure. When the Minute wave ((a)) of 4 ended at 1618.1 and Minute wave ((b)) of 4 ended at 1639.

Above from 1607.23 low the index has already made a new high confirming Minor wave 5 of (1) has resumed. The rally is expected to take the form of another zigzag structure. As far as near-term dips remain above 1607.23 level, the index has scope to extend higher towards 1680.67 area before ending Intermediate wave (1). Afterwards, the index is expected to do a pullback in intermediate wave (2) in 3, 7 or 11 swings before further upside is seen. We don’t like chasing it here because it has already reached the minimum extension area for Minor wave 5. I.e it has reached inverse 1.236-1.618% Fibonacci extension area of 4 at 1652.50-1666.59 area.

Russell 1 Hour Elliott Wave Chart
Ayoub Ben Rejeb غير متواجد حالياً  
رد مع اقتباس

عضو نشيط
 
تاريخ التسجيل: Dec 2013
الدولة: Tunisia
المشاركات: 282
خبرة السوق: أكثر من 5 سنوات
معدل تقييم المستوى: 13
Ayoub Ben Rejeb is on a distinguished road
افتراضي رد: Elliott Wave Analysis by EWF
262#
01 - 06 - 2018, 05:41 PM
USDJPY Elliott Wave view: Calling For Bounces To Fail Ahead of NFP?

USDJPY Short-term Elliott Wave view suggests that the rally to 111.40 on May 21 ended intermediate wave (A) as a Diagonal structure coming from March 26 low (104.52) cycle. Pair is currently correcting cycle from 3/26 low within Intermediate wave (B). The pullback shows overlapping price structure suggesting that it is taking the form of a corrective structure i.e either as W,X,Y or W,X,Y,X,Z structure.

Down from 111.40 high, the decline to 108.94 low ended Minute wave ((a)) of W in 5 waves. The bounce to 109.83 high then ended Minute wave ((b)) of W in 3 waves bounce. Afterwards, the decline to 108.10 low ended Minute wave ((c)) and also completed Minor wave W as an Elliott Wave Zigzag structure. Up from there, Minor wave X bounce is in progress to correct the cycle from 111.40 high. The rally should fail in 3, 7 or 11 swings for further downside correction as far as pivot at 111.4 high stays intact. Near-term focus remains towards 109.35-109.59 to finish Minor wave X. This is the 100%-123.6% Fibonacci extension area of Minute wave ((a))-((b)) of a zigzag structure. Once wave X is complete, pair should resume lower provided the pivot at 111.40 high stays intact or should react lower in 3 swings at least. We don’t like buying the proposed rally.

USDJPY 1 Hour Elliott Wave Chart
Ayoub Ben Rejeb غير متواجد حالياً  
رد مع اقتباس
عضو نشيط
 
تاريخ التسجيل: Dec 2013
الدولة: Tunisia
المشاركات: 282
خبرة السوق: أكثر من 5 سنوات
معدل تقييم المستوى: 13
Ayoub Ben Rejeb is on a distinguished road
افتراضي رد: Elliott Wave Analysis by EWF
263#
05 - 06 - 2018, 05:47 PM
SPX Elliott Wave Analysis: Close To A Pullback?

SPX short-term Elliott wave view suggests that the rally from 4/02/2018 low (2553.8) is extending higher in 5 waves structure. These 5 waves are expected to be part of a leading diagonal structure within intermediate wave (1) higher. The move higher from 2553.8 low has the characteristic of a diagonal where the internal distribution of each leg higher shows sub-division of 3 waves and there’s an overlap between Minor wave 1 & 4 .

The internals of a rally from 2553.8 low ended Minor wave 1 at 2717.49 in 3 waves corrective sequence. Down from there, the pullback to 2594.62 low ended Minor wave 2 as Elliott wave double three structure. Above from there, the rally to 2742.1 high ended Minor wave 3 as Elliott Wave Zigzag structure. Below from there, the pullback to 2676.81 low ended Minor wave 4 as zigzag structure. Near-term focus remains towards 2752.9 – 2765.33, which is 100%-123.6% Fibonacci extension area of Minute wave ((a))-((b)) to end Minor wave 5. The move higher should also complete the cycle from 4/02/2018 low (2553.8) within Intermediate wave (1). Afterwards, the index is expected to do a pullback in Intermediate wave (2) and expected to find buyers in 3, 7 or 11 swings for further upside. We don’t like selling the index.

SPX 1 Hour Elliott Wave Chart
Ayoub Ben Rejeb غير متواجد حالياً  
رد مع اقتباس
عضو نشيط
 
تاريخ التسجيل: Dec 2013
الدولة: Tunisia
المشاركات: 282
خبرة السوق: أكثر من 5 سنوات
معدل تقييم المستوى: 13
Ayoub Ben Rejeb is on a distinguished road
افتراضي رد: Elliott Wave Analysis by EWF
264#
06 - 06 - 2018, 05:45 PM
FTSE Elliott Wave View: Buying Opportunity Soon

FTSE short-term Elliott wave view suggests that the rally to 7903.50 high on 5/22/2018 peak ended primary wave ((1)). This rally to 7903.5 starts from 3/23/2018 low and took the form of an impulse Elliott wave structure. The index is currently in Primary wave ((2) pullback to correct cycle from 3/23/2018 low.

So far the decline from the peak shows an overlapping internal structure, suggesting the index is pulling back in corrective sequence i.e either as W,X,Y or W,X,Y,X,Z structure. Down from 7903.5 high, the decline to 7610.66 low ended the first leg of the pullback in Intermediate wave (W). The internals of Intermediate wave (W) unfolded as Elliott wave Zigzag structure where Minor wave A ended at 7703.26, Minor wave B ended at 7738.46, and Minor wave C of (W) ended at 7610.66.

Above from 7610.66, the bounce to 7772.12 high ended Intermediate wave (X). The internals of Intermediate wave (X) unfolded as Elliott wave double three structure where Minor wave W ended at 7727.45, Minor wave X ended at 7651.412, and Minor wave Y of (X) ended at 7772.12. Near-term, while below 7772.12 Intermediate wave (X) high, expect the Index to extend lower in Intermediate wave (Y). Intermediate wave (Y) should see more downside towards 7477.94-7408.77, which is 100%-123.6% Fibonacci extension area of Intermediate wave (W)-(X). This move lower should also end Primary wave ((2)) pullback & Index should resume higher again. We don’t like selling the index.

FTSE 1 Hour Elliott Wave Chart
Ayoub Ben Rejeb غير متواجد حالياً  
رد مع اقتباس
عضو نشيط
 
تاريخ التسجيل: Dec 2013
الدولة: Tunisia
المشاركات: 282
خبرة السوق: أكثر من 5 سنوات
معدل تقييم المستوى: 13
Ayoub Ben Rejeb is on a distinguished road
افتراضي رد: Elliott Wave Analysis by EWF
265#
07 - 06 - 2018, 05:27 PM
Copper Elliott Wave View: Next Extension Higher may have started

Copper ticker symbol: HG_F short-term Elliott wave view suggests that the pullback to 3.0101 on 5/30/2018 ended Intermediate wave (2). The internals of Intermediate wave (2) unfolded as Elliott wave double three structure where Minor wave W ended at 3.0195. Minor wave X ended at 3.1485 high and the decline to 3.0101 low ended Minor wave Y of (2).

Above from there, the metal has started the next extension higher in intermediate wave (3). The rally looks to unfolding as Elliott wave impulse with extension in Minor wave 3 higher. The internal sub-division of Minor wave 1 and 3 show 5 waves distribution, confirming the impulse structure. Up from 3.0101 low, the rally to 3.093 high ended Minor wave 1 in 5 waves structure. Afterwards, the pullback to 3.046 low ended Minor wave 2 and Minor wave 3 rally remains in progress and expected to complete soon. Once Minor wave 3 ends, Minor 4 pullback should take place in 3, 7 or 11 swings to correct cycle from 5/31 low before the metal extends higher again in Minor wave 5 to complete the 5 waves impulse structure from 3.0101 low within intermediate wave (3) higher. We don’t like selling the metal into a proposed pullback.

Copper 1 Hour Elliott Wave Chart
Ayoub Ben Rejeb غير متواجد حالياً  
رد مع اقتباس
عضو نشيط
 
تاريخ التسجيل: Dec 2013
الدولة: Tunisia
المشاركات: 282
خبرة السوق: أكثر من 5 سنوات
معدل تقييم المستوى: 13
Ayoub Ben Rejeb is on a distinguished road
افتراضي رد: Elliott Wave Analysis by EWF
266#
08 - 06 - 2018, 05:39 PM
Google (GOOGL) : Elliott wave structure looking for $1250.00

Google is still within a powerful wave ((III) and in the process of ending a super cycle degree in the next few years. We believe the cycle which started at 2009 low will end sometimes between 2020-2022. By that time, Google would have reached the minimum target of $1250. It can extend even higher, and we do not see any reason yet to sell.

In contrary, the stock provided us a nice long opportunity earlier this year. We believe the stock will make a new all time high, which consequently makes it a buy in 3-7-11 waves back. The following chart provides an illustration of our view and the video also explains The One Market Concept and how Google should still trade higher within wave ((III)).

Google (GOOGL) Monthly Elliott Wave Analysis


As can be seen in the chart above, we are labelling the rally from all-time low as an impulse Elliott Wave Structure. The stock is proposed to be in super cycle degree wave ((III)). The rally to $1179.86 on January 2018 high ended Cycle Degree wave III of ((III)), and the pullback to $980.64 on March 2018 low ended Cycle Degree wave IV of ((III)). While pullback stays above $980.64, expect Google to extend higher to $1250.97 – $1322.02 to end Cycle Degree wave V of ((III)). Then the stock should pullback in Super Cycle degree wave ((IV)) to correct cycle from 2009 low before the rally resumes. We don’t like selling the stock.
Ayoub Ben Rejeb غير متواجد حالياً  
رد مع اقتباس
عضو نشيط
 
تاريخ التسجيل: Dec 2013
الدولة: Tunisia
المشاركات: 282
خبرة السوق: أكثر من 5 سنوات
معدل تقييم المستوى: 13
Ayoub Ben Rejeb is on a distinguished road
افتراضي رد: Elliott Wave Analysis by EWF
267#
11 - 06 - 2018, 06:00 PM
Nifty Elliott Wave View Showing Perfect 5 Waves Advance

NIFTY is trading in the powerful super cycle degree wave ((III) and should have further upside in the next few years. The rally started at 2009 low and we believe the cycle will continue until 2020-2022. The minimum target of the cycle is $11507, but it can extend even higher to 12634 area, which is where 1.618 Fibonacci extension within the Grand Super cycle degree will be reached.

We do not see any reason to sell yet, and in contrary, the Index gave us a good long opportunity earlier this year. The Index should continue to make a new all time high, and the right side still remains to buy in 3-7-11 waves back. The following chart shows our view and the video also explains The One Market Concept and how The Index should still trade higher within wave (III).

NIFTY long term Elliott Wave Analysis


From the chart above, we can see the rally from all-time low is unfolding as an Impulse Elliott Wave Structure. The Index is currently within Super Cycle degree wave (III). The rally to 11171.55 on January 2018 high ended Primary Degree wave ((3)) of V, and the pullback to 9958.55 on March 2018 low ended Primary Degree wave ((4)) of V. While pullback stays above $9958.55, expect the Index to extend higher to $11507-12634 to end Cycle Degree wave V of (III). Then the Index should pullback in Super Cycle degree wave (IV) to correct cycle from 2009 low before the rally resumes. We don’t like selling the Index.
Ayoub Ben Rejeb غير متواجد حالياً  
رد مع اقتباس
عضو نشيط
 
تاريخ التسجيل: Dec 2013
الدولة: Tunisia
المشاركات: 282
خبرة السوق: أكثر من 5 سنوات
معدل تقييم المستوى: 13
Ayoub Ben Rejeb is on a distinguished road
افتراضي رد: Elliott Wave Analysis by EWF
268#
12 - 06 - 2018, 05:50 PM
Dow Jones Nearing Completion of 5 Waves Impulse

Dow Jones futures ticker symbol: $YM_F short-term Elliott wave view suggests that the pullback to 24227 low on 5/29/2018 ended Minor wave 4 pullback. Above from there, the rally is unfolding as impulse Elliott wave structure with extension in 3rd wave higher. As impulse, the internal of Minute degree wave ((i)), ((iii)) and ((v)) should also unfold as an impulse with 5 waves structure.

Up from 24227 low, Minute degree wave ((i)) ended in 5 waves structure at 24715. Down from there, the pullback to 24342 low ended Minute degree wave ((ii)). The rally from there shows a strong reaction to the upside which could end Minute wave ((iii)) at 25418 high. The subdivision of Minute wave ((iii)) show lesser degree impulse structure where Minutte wave (i) ended at 24863, Minutte wave (ii) ended at 24709, Minutte wave (iii) ended at 25327. Minutte wave (iv) ended at 25093 and Minutte wave (v) of ((iii)) ended at 25418 high. Near-term, Minute degree wave ((iv)) pullback is in progress in 3, 7 or 11 swings. As far as a pivot from 24337 low stays intact, expect the Index to see another push higher in Minute wave ((v)) to end 5 waves impulse structure from 5/29/2018 low. The move higher should also complete Minor degree wave 5. We don’t like selling the proposed pullback.

Dow Jones 1 Hour Elliott Wave Chart
Ayoub Ben Rejeb غير متواجد حالياً  
رد مع اقتباس
عضو نشيط
 
تاريخ التسجيل: Dec 2013
الدولة: Tunisia
المشاركات: 282
خبرة السوق: أكثر من 5 سنوات
معدل تقييم المستوى: 13
Ayoub Ben Rejeb is on a distinguished road
افتراضي رد: Elliott Wave Analysis by EWF
269#
12 - 06 - 2018, 06:26 PM
The Sen*** Index Long Term Bullish Cycles

The Sen*** Index long term bullish cycles have been trending higher with other world indices. Firstly in it’s base year 1978 to 1979 the index’s point value was set at 100. From there it rallied with other world indices trending higher into the January 2008 highs. It then corrected the bullish cycle as did most other world indices. It ended that larger degree correction in October 2008. From those 2008 lows, the index shows a 5 swing sequence that favors further upside. Price has reached and exceeded the .618 Fibonacci extension of the 2008 to 2015 bullish cycle.

Secondly, this Fibonacci extension is measured is as follows. Use a Fibonacci extension tool on a charting platform. Point 1 will be at the beginning of the cycle at the 2008 lows. From there on up to the 2015 highs will be point 2. The point 3 will be down at the 2016 lows. As earlier mentioned, the index in January 2018 saw the .618 Fibonacci extension of the 2008 to 2015 cycle. In most cases a fifth swing will end in this .618 – .764 Fibonacci extension area. The analysis continues below the chart.

Sen*** Index Monthly Chart
[IMG]https://elliottwave-forecast.com/wp-content/uploads/2018/06/sen***M.png[/IMG]


The currently favored view is the Sen*** index dip lower from the 5th swing high ended the cycle up from the 2016 lows. It did a 3 swing pullback to the March 2018 lows to complete the 6th swing. Thus at this point it is favored to remain above there during dips. The most bearish near term case is if it remains below the January 2018 highs it can continue a pullback in the 6th swing in 3 more swings. This would make a possible 7, or 11 swings to correct the cycle up from the 2016 low which should be similar to the 2nd swing pullback of 2011 or the 4th swing of 2016.

In conclusion. Either way while price is above the February 2016 lows the Fibonacci extension areas remain the same. Afterward of completion of the 6th swing pullback it should see more upside in the 7th swing toward the 44792-50078 area.
Ayoub Ben Rejeb غير متواجد حالياً  
رد مع اقتباس
عضو نشيط
 
تاريخ التسجيل: Dec 2013
الدولة: Tunisia
المشاركات: 282
خبرة السوق: أكثر من 5 سنوات
معدل تقييم المستوى: 13
Ayoub Ben Rejeb is on a distinguished road
افتراضي رد: Elliott Wave Analysis by EWF
270#
13 - 06 - 2018, 05:29 PM
Intraday Elliott Wave Analysis: SPX Due for Pullback Soon

SPX short-term Elliott wave view suggests that the rally to 2742.24 high ended Minor wave 3 as Elliott wave impulse. Below from there the pullback to 2676.81 on 5/29/2018 low ended Minor wave 4 as Zigzag structure. Up from there, Minor wave 5 rally is unfolding as impulse Elliott wave structure with extension in 3rd wave higher. As an impulse, the internal subdivisions of Minute degree wave ((i)), ((iii)) and ((v)) should unfold as 5 waves structure. On the other hand, the corrective Minute degree wave ((ii)) & ((iv)) should unfold in any 3 wave corrective sequence i.e double three, triple, flats etc.

The first leg of the rally from Minor wave 4 at 2676.81 low ended Minute wave ((i)) as 5 waves structure at 2729.34. Then the pullback to 2700.88 low ended Minute wave ((ii). Above from there, the index rallied higher in extended Minute wave ((iii)) which ended at 2790.21 high. Down from there, Minute wave ((iv)) pullback looks complete at 2778.78 low and index can now see the last push higher towards 2801.31-2820.07 area before ending Minor wave 5. The last push higher should also complete Intermediate wave (1). Afterwards, the index is expected to do an intermediate wave (2) pullback in 3, 7 or 11 swings to correct cycle from April 3 low before further upside is seen. We don’t like selling the proposed pullback.

SPX 1 Hour Elliott Wave Chart
Ayoub Ben Rejeb غير متواجد حالياً  
رد مع اقتباس


إضافة رد

الكلمات الدلالية (Tags)
commodity, elliott wave, forex, stocks

أدوات الموضوع


جديد مواضيع منتدى تداول العملات العام

المواضيع المتشابهه
الموضوع كاتب الموضوع المنتدى مشاركات آخر مشاركة
elliott wave Nnana123 منتدى تداول العملات العام 6 11 - 04 - 2015 07:07 PM


12:22 PM